Flutter for OpenHarmony 第三方库实战:使用 fl_chart 构建消费统计图表应用
欢迎加入开源鸿蒙跨平台社区:
https://openharmonycrossplatform.csdn.net
项目效果
本文实现的是一个基于 Flutter for OpenHarmony 的消费统计图表应用。项目中使用 Flutter 第三方图表库 fl_chart,将不同消费分类的数据展示为饼图和柱状图。
最终运行效果如下:
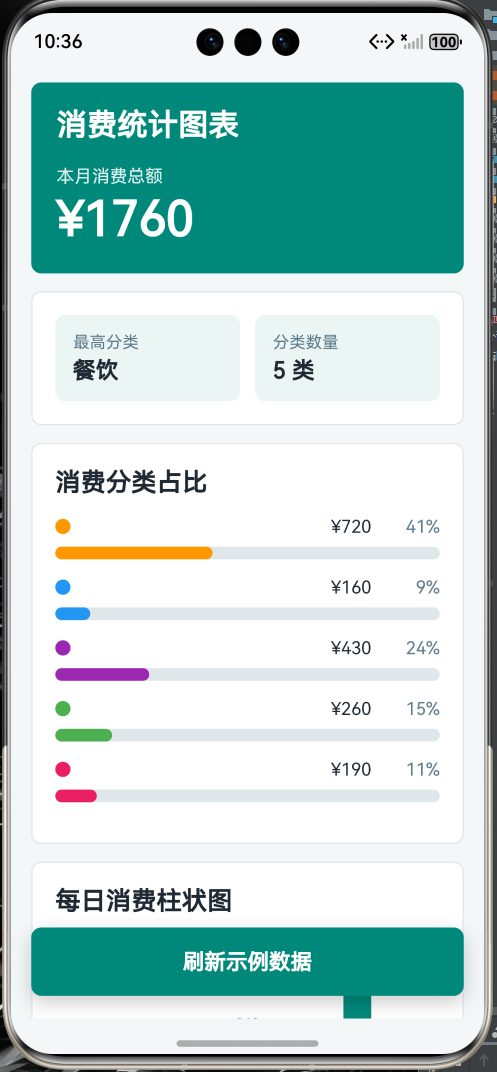
页面主要包含以下内容:
- 顶部标题栏;
- 本月消费总额展示;
- 消费分类饼图;
- 每日消费柱状图;
- 消费分类明细列表;
- 刷新示例数据按钮;
- 第三方库使用说明;
- 页面整体采用 Flutter Material 风格布局。
本文重点是演示如何在 Flutter for OpenHarmony 项目中使用 Flutter 第三方库 fl_chart 绘制图表。项目代码写在 lib/main.dart 中,依赖配置写在 pubspec.yaml 中,符合 Flutter for OpenHarmony 第三方库实践方向。
前言
在移动应用开发中,数据可视化是非常常见的功能。相比直接展示一堆数字,图表可以更直观地表达数据变化和占比关系。
例如在消费统计应用中,我们可能需要展示:
- 本月总消费;
- 各类消费占比;
- 每日消费变化;
- 哪一类消费最多;
- 不同消费类型之间的对比。
如果只用普通文本和列表展示,用户需要自己脑补数据关系。人脑已经够忙了,还要它当图表引擎,多少有点不人道。
因此本文选择使用 Flutter 第三方库 fl_chart 来实现图表展示。fl_chart 是 Flutter 中常用的图表库,可以绘制折线图、柱状图、饼图等多种图表。
本项目以“消费统计图表应用”为例,使用 fl_chart 绘制消费分类饼图和每日消费柱状图,并通过 Flutter 页面展示完整的统计结果。
一、项目目标
本次实践主要实现以下目标:
- 创建 Flutter for OpenHarmony 项目;
- 在
pubspec.yaml中添加第三方库fl_chart; - 使用
flutter pub get获取依赖; - 在
lib/main.dart中引入fl_chart; - 使用
PieChart绘制消费分类占比图; - 使用
BarChart绘制每日消费柱状图; - 使用 Flutter Material 组件构建页面;
- 展示消费总额、分类明细和图表说明;
- 将应用运行到 OpenHarmony 设备或模拟器中。
二、技术栈
| 类型 | 内容 |
|---|---|
| 开发方向 | Flutter for OpenHarmony |
| 开发语言 | Dart |
| UI 框架 | Flutter |
| 第三方库 | fl_chart |
| 功能场景 | 数据可视化 / 消费统计 |
| 图表类型 | 饼图 / 柱状图 |
| 项目入口 | lib/main.dart |
| 依赖配置 | pubspec.yaml |
| 运行平台 | OpenHarmony 设备或模拟器 |
三、为什么选择 fl_chart
在实际应用中,图表展示需求非常常见。例如:
- 消费统计;
- 学习时长统计;
- 运动数据统计;
- 销售额变化;
- 用户增长趋势;
- 分类占比分析;
- 每日任务完成数量;
- 设备监测数据展示。
如果完全自己使用 Flutter 原生组件绘制图表,工作量会比较大。坐标轴、比例计算、柱状图高度、饼图角度、标签展示等都需要自己处理。
fl_chart 可以帮助开发者更方便地绘制常见图表。它提供了 PieChart、BarChart、LineChart 等组件,可以直接在 Flutter 页面中使用。
在本项目中,fl_chart 主要完成以下工作:
- 绘制消费分类饼图;
- 绘制每日消费柱状图;
- 展示不同分类的消费占比;
- 展示一周内每日消费变化;
- 提升数据展示的直观性。
四、创建 Flutter for OpenHarmony 项目
在已经配置好 Flutter for OpenHarmony 开发环境的前提下,可以创建一个 Flutter 项目。
示例项目名称:
flutter create expense_chart_demo
进入项目目录:
cd expense_chart_demo
项目创建完成后,主要关注两个文件:
expense_chart_demo
 ├── pubspec.yaml
 └── lib
     └── main.dart
其中:
| 文件 | 作用 |
|---|---|
| pubspec.yaml | 配置 Flutter 项目依赖 |
| lib/main.dart | 编写 Flutter 页面和业务逻辑 |
五、添加 fl_chart 第三方库
打开项目根目录下的 pubspec.yaml 文件,在 dependencies 中添加 fl_chart。
示例配置如下:
dependencies:
  flutter:
    sdk: flutter

  fl_chart: ^1.2.0
完整结构大致如下:
name: expense_chart_demo
description: A Flutter for OpenHarmony fl_chart demo.
publish_to: 'none'

version: 1.0.0+1

environment:
  sdk: '>=3.4.0 <4.0.0'

dependencies:
  flutter:
    sdk: flutter

  fl_chart: ^1.2.0

dev_dependencies:
  flutter_test:
    sdk: flutter

flutter:
  uses-material-design: true
添加完成后,在终端执行:
flutter pub get
执行成功后,就可以在 Dart 代码中使用 fl_chart 了。
六、项目结构
本项目主要修改 lib/main.dart 文件:
lib
 └── main.dart
本项目不需要编写 OpenHarmony 原生 ArkTS 页面,也不需要修改 Index.ets。
因为这是 Flutter for OpenHarmony 项目,页面主体应该是 Flutter 代码。审核主要看的是:
- 是否使用
pubspec.yaml添加 Flutter 第三方库; - 是否在 Dart 文件中
import package; - 是否在
lib/main.dart中实际调用第三方库; - 是否属于 Flutter for OpenHarmony 项目。
七、核心实现思路
本项目的核心流程如下:
- 在
pubspec.yaml中添加fl_chart; - 在
main.dart中引入第三方库; - 定义消费分类数据;
- 定义每日消费数据;
- 计算本月消费总额;
- 使用
PieChart展示分类占比; - 使用
BarChart展示每日消费; - 使用列表展示分类明细;
- 使用按钮刷新示例数据。
第三方库引入代码如下:
import 'package:fl_chart/fl_chart.dart';
饼图核心代码如下:
PieChart(
  PieChartData(
    sections: sections,
  ),
)
柱状图核心代码如下:
BarChart(
  BarChartData(
    barGroups: groups,
  ),
)
这几段代码能明确说明项目确实使用了 Flutter 第三方图表库。
八、main.dart 完整代码
打开文件:
lib/main.dart
将其中内容替换为下面代码:
import 'package:fl_chart/fl_chart.dart';
import 'package:flutter/material.dart';
void main() {
runApp(const ExpenseChartApp());
}
class ExpenseChartApp extends StatelessWidget {
const ExpenseChartApp({super.key});
Widget build(BuildContext context) {
return MaterialApp(
title: 'Expense Chart Demo',
debugShowCheckedModeBanner: false,
theme: ThemeData(
colorScheme: ColorScheme.fromSeed(
seedColor: Colors.teal,
brightness: Brightness.light,
),
useMaterial3: true,
),
home: const ExpenseHomePage(),
);
}
}
class ExpenseItem {
const ExpenseItem({
required this.name,
required this.amount,
required this.color,
});
final String name;
final double amount;
final Color color;
}
class DailyExpense {
const DailyExpense({
required this.day,
required this.amount,
});
final String day;
final double amount;
}
class ExpenseHomePage extends StatefulWidget {
const ExpenseHomePage({super.key});
State<ExpenseHomePage> createState() => _ExpenseHomePageState();
}
class _ExpenseHomePageState extends State<ExpenseHomePage> {
bool _useSecondData = false;
List<ExpenseItem> get _categoryExpenses {
if (_useSecondData) {
return const [
ExpenseItem(name: '餐饮', amount: 860, color: Colors.orange),
ExpenseItem(name: '交通', amount: 220, color: Colors.blue),
ExpenseItem(name: '购物', amount: 530, color: Colors.purple),
ExpenseItem(name: '娱乐', amount: 180, color: Colors.green),
ExpenseItem(name: '学习', amount: 310, color: Colors.redAccent),
];
}
return const [
ExpenseItem(name: '餐饮', amount: 720, color: Colors.orange),
ExpenseItem(name: '交通', amount: 160, color: Colors.blue),
ExpenseItem(name: '购物', amount: 430, color: Colors.purple),
ExpenseItem(name: '娱乐', amount: 260, color: Colors.green),
ExpenseItem(name: '学习', amount: 190, color: Colors.redAccent),
];
}
List<DailyExpense> get _dailyExpenses {
if (_useSecondData) {
return const [
DailyExpense(day: '周一', amount: 120),
DailyExpense(day: '周二', amount: 260),
DailyExpense(day: '周三', amount: 180),
DailyExpense(day: '周四', amount: 320),
DailyExpense(day: '周五', amount: 240),
DailyExpense(day: '周六', amount: 410),
DailyExpense(day: '周日', amount: 280),
];
}
return const [
DailyExpense(day: '周一', amount: 90),
DailyExpense(day: '周二', amount: 180),
DailyExpense(day: '周三', amount: 130),
DailyExpense(day: '周四', amount: 260),
DailyExpense(day: '周五', amount: 210),
DailyExpense(day: '周六', amount: 360),
DailyExpense(day: '周日', amount: 240),
];
}
double get _totalExpense {
double total = 0;
for (final ExpenseItem item in _categoryExpenses) {
total += item.amount;
}
return total;
}
ExpenseItem get _maxExpenseItem {
ExpenseItem maxItem = _categoryExpenses.first;
for (final ExpenseItem item in _categoryExpenses) {
if (item.amount > maxItem.amount) {
maxItem = item;
}
}
return maxItem;
}
void _refreshData() {
setState(() {
_useSecondData = !_useSecondData;
});
}
Widget build(BuildContext context) {
final ThemeData theme = Theme.of(context);
return Scaffold(
appBar: AppBar(
title: const Text('消费统计图表'),
centerTitle: true,
),
body: SafeArea(
child: ListView(
padding: const EdgeInsets.all(16),
children: [
_buildOverviewCard(theme),
const SizedBox(height: 16),
_buildPieChartCard(theme),
const SizedBox(height: 16),
_buildBarChartCard(theme),
const SizedBox(height: 16),
_buildDetailCard(theme),
const SizedBox(height: 16),
_buildLibraryCard(theme),
],
),
),
floatingActionButton: FloatingActionButton.extended(
onPressed: _refreshData,
icon: const Icon(Icons.refresh),
label: const Text('刷新数据'),
),
);
}
Widget _buildOverviewCard(ThemeData theme) {
return Card(
elevation: 2,
shape: RoundedRectangleBorder(
borderRadius: BorderRadius.circular(18),
),
child: Padding(
padding: const EdgeInsets.all(20),
child: Column(
children: [
Row(
children: [
Container(
width: 56,
height: 56,
decoration: BoxDecoration(
color: theme.colorScheme.primaryContainer,
borderRadius: BorderRadius.circular(28),
),
child: Icon(
Icons.account_balance_wallet,
color: theme.colorScheme.onPrimaryContainer,
),
),
const SizedBox(width: 16),
Expanded(
child: Column(
crossAxisAlignment: CrossAxisAlignment.start,
children: [
Text(
'本月消费总额',
style: theme.textTheme.bodyMedium?.copyWith(
color: theme.colorScheme.onSurfaceVariant,
),
),
const SizedBox(height: 4),
Text(
'¥${_totalExpense.toStringAsFixed(0)}',
style: theme.textTheme.headlineMedium?.copyWith(
fontWeight: FontWeight.bold,
color: theme.colorScheme.primary,
),
),
],
),
),
],
),
const SizedBox(height: 18),
Row(
children: [
Expanded(
child: _buildSmallInfo(
theme,
title: '最高分类',
value: _maxExpenseItem.name,
icon: Icons.trending_up,
),
),
Expanded(
child: _buildSmallInfo(
theme,
title: '分类数量',
value: '${_categoryExpenses.length} 类',
icon: Icons.category,
),
),
],
),
],
),
),
);
}
Widget _buildSmallInfo(
ThemeData theme, {
required String title,
required String value,
required IconData icon,
}) {
return Row(
children: [
Icon(
icon,
color: theme.colorScheme.primary,
size: 20,
),
const SizedBox(width: 8),
Column(
crossAxisAlignment: CrossAxisAlignment.start,
children: [
Text(
title,
style: theme.textTheme.bodySmall?.copyWith(
color: theme.colorScheme.onSurfaceVariant,
),
),
Text(
value,
style: theme.textTheme.bodyMedium?.copyWith(
fontWeight: FontWeight.bold,
),
),
],
),
],
);
}
Widget _buildPieChartCard(ThemeData theme) {
final List<PieChartSectionData> sections = _categoryExpenses.map((item) {
final double percent = item.amount / _totalExpense * 100;
return PieChartSectionData(
value: item.amount,
title: '${percent.toStringAsFixed(0)}%',
color: item.color,
radius: 64,
titleStyle: const TextStyle(
fontSize: 13,
fontWeight: FontWeight.bold,
color: Colors.white,
),
);
}).toList();
return Card(
elevation: 2,
shape: RoundedRectangleBorder(
borderRadius: BorderRadius.circular(18),
),
child: Padding(
padding: const EdgeInsets.all(20),
child: Column(
crossAxisAlignment: CrossAxisAlignment.start,
children: [
Text(
'消费分类占比',
style: theme.textTheme.titleLarge?.copyWith(
fontWeight: FontWeight.bold,
),
),
const SizedBox(height: 18),
SizedBox(
height: 240,
child: PieChart(
PieChartData(
sections: sections,
centerSpaceRadius: 42,
sectionsSpace: 3,
),
),
),
const SizedBox(height: 12),
Wrap(
spacing: 12,
runSpacing: 8,
children: _categoryExpenses.map((item) {
return _buildLegendItem(theme, item);
}).toList(),
),
],
),
),
);
}
Widget _buildLegendItem(ThemeData theme, ExpenseItem item) {
return Row(
mainAxisSize: MainAxisSize.min,
children: [
Container(
width: 12,
height: 12,
decoration: BoxDecoration(
color: item.color,
borderRadius: BorderRadius.circular(6),
),
),
const SizedBox(width: 6),
Text(
item.name,
style: theme.textTheme.bodySmall,
),
],
);
}
Widget _buildBarChartCard(ThemeData theme) {
final double maxAmount = _dailyExpenses
.map((item) => item.amount)
.reduce((a, b) => a > b ? a : b);
final List<BarChartGroupData> groups = [];
for (int i = 0; i < _dailyExpenses.length; i++) {
final DailyExpense item = _dailyExpenses[i];
groups.add(
BarChartGroupData(
x: i,
barRods: [
BarChartRodData(
toY: item.amount,
width: 18,
color: theme.colorScheme.primary,
borderRadius: BorderRadius.circular(6),
),
],
),
);
}
return Card(
elevation: 2,
shape: RoundedRectangleBorder(
borderRadius: BorderRadius.circular(18),
),
child: Padding(
padding: const EdgeInsets.all(20),
child: Column(
crossAxisAlignment: CrossAxisAlignment.start,
children: [
Text(
'每日消费变化',
style: theme.textTheme.titleLarge?.copyWith(
fontWeight: FontWeight.bold,
),
),
const SizedBox(height: 18),
SizedBox(
height: 260,
child: BarChart(
BarChartData(
maxY: maxAmount + 80,
minY: 0,
barGroups: groups,
gridData: FlGridData(
show: true,
drawVerticalLine: false,
horizontalInterval: 100,
getDrawingHorizontalLine: (value) {
return FlLine(
color: theme.dividerColor.withOpacity(0.4),
strokeWidth: 1,
);
},
),
borderData: FlBorderData(show: false),
titlesData: FlTitlesData(
topTitles: const AxisTitles(
sideTitles: SideTitles(showTitles: false),
),
rightTitles: const AxisTitles(
sideTitles: SideTitles(showTitles: false),
),
leftTitles: const AxisTitles(
sideTitles: SideTitles(
showTitles: true,
reservedSize: 38,
),
),
bottomTitles: AxisTitles(
sideTitles: SideTitles(
showTitles: true,
reservedSize: 32,
getTitlesWidget: (value, meta) {
final int index = value.toInt();
if (index < 0 || index >= _dailyExpenses.length) {
return const SizedBox.shrink();
}
return Padding(
padding: const EdgeInsets.only(top: 8),
child: Text(
_dailyExpenses[index].day.replaceAll('周', ''),
style: theme.textTheme.bodySmall,
),
);
},
),
),
),
),
),
),
],
),
),
);
}
Widget _buildDetailCard(ThemeData theme) {
return Card(
elevation: 2,
shape: RoundedRectangleBorder(
borderRadius: BorderRadius.circular(18),
),
child: Padding(
padding: const EdgeInsets.all(20),
child: Column(
crossAxisAlignment: CrossAxisAlignment.start,
children: [
Text(
'消费分类明细',
style: theme.textTheme.titleLarge?.copyWith(
fontWeight: FontWeight.bold,
),
),
const SizedBox(height: 12),
..._categoryExpenses.map((item) {
final double percent = item.amount / _totalExpense * 100;
return Padding(
padding: const EdgeInsets.only(bottom: 12),
child: Row(
children: [
Container(
width: 14,
height: 14,
decoration: BoxDecoration(
color: item.color,
borderRadius: BorderRadius.circular(7),
),
),
const SizedBox(width: 10),
SizedBox(
width: 56,
child: Text(
item.name,
style: theme.textTheme.bodyMedium?.copyWith(
fontWeight: FontWeight.bold,
),
),
),
Expanded(
child: LinearProgressIndicator(
value: item.amount / _totalExpense,
minHeight: 8,
borderRadius: BorderRadius.circular(8),
color: item.color,
backgroundColor: item.color.withOpacity(0.15),
),
),
const SizedBox(width: 10),
SizedBox(
width: 76,
child: Text(
'¥${item.amount.toStringAsFixed(0)}',
textAlign: TextAlign.right,
style: theme.textTheme.bodyMedium,
),
),
SizedBox(
width: 52,
child: Text(
'${percent.toStringAsFixed(0)}%',
textAlign: TextAlign.right,
style: theme.textTheme.bodySmall?.copyWith(
color: theme.colorScheme.onSurfaceVariant,
),
),
),
],
),
);
}),
],
),
),
);
}
Widget _buildLibraryCard(ThemeData theme) {
return Card(
elevation: 2,
shape: RoundedRectangleBorder(
borderRadius: BorderRadius.circular(18),
),
child: Padding(
padding: const EdgeInsets.all(20),
child: Column(
crossAxisAlignment: CrossAxisAlignment.start,
children: [
Text(
'第三方库说明',
style: theme.textTheme.titleLarge?.copyWith(
fontWeight: FontWeight.bold,
),
),
const SizedBox(height: 12),
_buildInfoRow(
theme,
title: '库名称',
value: 'fl_chart',
),
_buildInfoRow(
theme,
title: '配置文件',
value: 'pubspec.yaml',
),
_buildInfoRow(
theme,
title: '导入方式',
value: "import 'package:fl_chart/fl_chart.dart';",
),
_buildInfoRow(
theme,
title: '核心组件',
value: 'PieChart / BarChart',
),
_buildInfoRow(
theme,
title: '应用场景',
value: '消费统计、数据分析、趋势展示、分类占比',
),
],
),
),
);
}
Widget _buildInfoRow(
ThemeData theme, {
required String title,
required String value,
}) {
return Padding(
padding: const EdgeInsets.only(bottom: 10),
child: Row(
crossAxisAlignment: CrossAxisAlignment.start,
children: [
SizedBox(
width: 82,
child: Text(
title,
style: theme.textTheme.bodyMedium?.copyWith(
fontWeight: FontWeight.bold,
),
),
),
Expanded(
child: Text(
value,
style: theme.textTheme.bodyMedium?.copyWith(
color: theme.colorScheme.onSurfaceVariant,
),
),
),
],
),
);
}
}
九、代码实现说明
1. 引入 fl_chart 第三方库
代码开头引入 fl_chart:
import 'package:fl_chart/fl_chart.dart';
这说明项目确实使用了 Flutter 第三方库,而不是 OpenHarmony 原生库。
本项目中主要使用两个图表组件:
PieChart
BarChart
其中:
| 组件 | 作用 |
|---|---|
| PieChart | 绘制饼图,用于展示分类占比 |
| BarChart | 绘制柱状图,用于展示每日消费变化 |
2. 定义消费分类数据
项目中定义了消费分类模型:
class ExpenseItem {
  const ExpenseItem({
    required this.name,
    required this.amount,
    required this.color,
  });

  final String name;
  final double amount;
  final Color color;
}
字段说明如下:
| 字段 | 作用 |
|---|---|
| name | 消费分类名称 |
| amount | 消费金额 |
| color | 图表颜色 |
例如:
ExpenseItem(name: '餐饮', amount: 720, color: Colors.orange)
表示餐饮消费为 720 元,并在图表中使用橙色显示。
3. 计算本月消费总额
消费总额通过遍历分类数据计算:
double get _totalExpense {
  double total = 0;
  for (final ExpenseItem item in _categoryExpenses) {
    total += item.amount;
  }
  return total;
}
这样页面顶部可以展示本月总消费金额。
4. 使用 PieChart 绘制消费分类占比
饼图的核心代码如下:
PieChart(
  PieChartData(
    sections: sections,
    centerSpaceRadius: 42,
    sectionsSpace: 3,
  ),
)
其中 sections 是饼图的每一个扇形区域:
PieChartSectionData(
  value: item.amount,
  title: '${percent.toStringAsFixed(0)}%',
  color: item.color,
  radius: 64,
)
字段说明如下:
| 字段 | 作用 |
|---|---|
| value | 当前分类的消费金额 |
| title | 饼图中显示的百分比 |
| color | 扇形颜色 |
| radius | 扇形半径 |
通过这部分代码,可以把不同消费分类转换为饼图扇形。
5. 使用 BarChart 绘制每日消费柱状图
柱状图核心代码如下:
BarChart(
  BarChartData(
    barGroups: groups,
  ),
)
每一根柱子使用 BarChartGroupData 和 BarChartRodData 创建:
BarChartGroupData(
  x: i,
  barRods: [
    BarChartRodData(
      toY: item.amount,
      width: 18,
      color: theme.colorScheme.primary,
    ),
  ],
)
其中:
| 字段 | 作用 |
|---|---|
| x | 当前柱子的横坐标 |
| toY | 当前柱子的高度 |
| width | 柱子的宽度 |
| color | 柱子的颜色 |
这样可以展示一周内每天的消费变化。
6. 自定义坐标轴标题
柱状图底部标题通过 getTitlesWidget 设置:
getTitlesWidget: (value, meta) {
  final int index = value.toInt();

  if (index < 0 || index >= _dailyExpenses.length) {
    return const SizedBox.shrink();
  }

  return Text(_dailyExpenses[index].day.replaceAll('周', ''));
}
这里会把:
周一、周二、周三
显示为:
一、二、三
让图表底部更加简洁。
7. 展示消费分类明细
除了图表,页面还使用列表展示每个分类的具体金额和占比:
LinearProgressIndicator(
  value: item.amount / _totalExpense,
)
这样用户既能看图表,也能看到准确金额。图表负责直观,列表负责精确,别让用户对着扇形猜钱数,太像智力测验。
8. 刷新示例数据
页面右下角提供了刷新按钮:
FloatingActionButton.extended(
  onPressed: _refreshData,
  icon: const Icon(Icons.refresh),
  label: const Text('刷新数据'),
)
点击后会切换两组示例数据:
void _refreshData() {
  setState(() {
    _useSecondData = !_useSecondData;
  });
}
这样可以观察图表随着数据变化而更新的效果。
十、运行项目
完成代码后,在终端执行:
flutter pub get
然后连接 OpenHarmony 设备或启动 OpenHarmony 模拟器。
查看设备:
flutter devices
运行项目:
flutter run
如果环境配置正确,应用会运行到 OpenHarmony 设备或模拟器中。
运行成功后,页面会显示“消费统计图表”。可以看到本月消费总额、消费分类饼图、每日消费柱状图和分类明细列表。
点击右下角“刷新数据”按钮后,饼图和柱状图会根据新的示例数据重新绘制。
十一、开发中遇到的问题
1. fl_chart 依赖没有生效
如果代码中出现找不到 fl_chart 的问题,可以检查 pubspec.yaml 中是否添加了:
fl_chart: ^1.2.0
然后重新执行:
flutter pub get
如果还是不行,可以重启编辑器。开发工具有时候不是没识别依赖,只是在装死,真是稳定发挥。
2. import 导入报错
如果下面代码报错:
import 'package:fl_chart/fl_chart.dart';
通常有几种原因:
pubspec.yaml中没有添加依赖;- 没有执行
flutter pub get; - YAML 缩进错误;
- 包名写错;
- 编辑器没有刷新依赖。
其中 YAML 缩进最容易出问题。配置文件对空格的敏感程度,简直像在考验人类手指稳定性。
3. 饼图没有显示
如果饼图没有显示,可以检查:
PieChart外层是否设置了高度;sections是否为空;value是否大于 0;- 是否正确引入了
fl_chart; - 页面是否被其他组件遮挡。
本项目中使用:
SizedBox(
  height: 240,
  child: PieChart(...),
)
给饼图设置了固定高度,避免因为布局约束问题导致无法显示。
4. 柱状图没有显示
如果柱状图没有显示,可以检查:
barGroups是否为空;toY是否为有效数值;maxY是否大于柱子高度;BarChart外层是否有高度;- 坐标轴配置是否写错。
本项目中使用:
SizedBox(
  height: 260,
  child: BarChart(...),
)
保证柱状图有足够显示空间。
5. 图表数据变化后页面没有刷新
如果点击按钮后数据变化但页面不更新,可以检查是否调用了:
setState(() {
  _useSecondData = !_useSecondData;
});
Flutter 页面状态变化后,需要通过 setState() 通知页面重新构建。
不调用 setState(),数据变了页面也不会理你。Flutter 不是读心术,虽然有些报错看起来像它在审判灵魂。
6. 运行不到 OpenHarmony 设备
如果项目无法运行到 OpenHarmony 设备或模拟器,可以检查:
- Flutter for OpenHarmony 环境是否配置完成;
- 设备是否连接成功;
flutter devices是否能识别设备;- 是否执行了
flutter pub get; - 是否选择了正确的运行设备;
- 项目是否为 Flutter 项目,而不是原生鸿蒙项目。
如果 flutter devices 都识别不到设备,那就先处理环境问题,不要盯着图表代码看半小时。代码很无辜,至少这一次可能是。
十二、本文和原生鸿蒙项目的区别
本文是 Flutter for OpenHarmony 第三方库实践,不是 OpenHarmony 原生 ArkTS 项目。
主要区别如下:
| 对比项 | 本文写法 | 原生鸿蒙写法 |
|---|---|---|
| UI 技术 | Flutter | ArkUI |
| 主要语言 | Dart | ArkTS |
| 页面入口 | lib/main.dart | Index.ets |
| 依赖配置 | pubspec.yaml | oh-package.json5 |
| 依赖安装 | flutter pub get | ohpm install |
| 第三方库 | fl_chart | OpenHarmony 原生库 |
| 页面组件 | MaterialApp / Scaffold / PieChart / BarChart | @Entry / @Component |
因此本文符合 Flutter for OpenHarmony 第三方库实践方向。
十三、总结
本篇完成了一个基于 fl_chart 的 Flutter for OpenHarmony 消费统计图表应用。项目通过 Flutter 第三方库 fl_chart 绘制消费分类饼图和每日消费柱状图,并结合 Flutter Material 组件展示消费总额、分类明细和图表说明。
通过本次实践,我主要完成了以下内容:
- 创建 Flutter for OpenHarmony 项目;
- 在
pubspec.yaml中添加fl_chart依赖; - 使用
flutter pub get获取第三方库; - 在
lib/main.dart中引入fl_chart; - 使用
PieChart绘制消费分类占比图; - 使用
BarChart绘制每日消费柱状图; - 使用
LinearProgressIndicator展示分类进度; - 使用 Flutter Material 组件构建统计页面;
- 使用
setState()切换示例数据并刷新图表; - 将项目运行到 OpenHarmony 设备或模拟器中。
这个项目虽然只是一个基础图表应用,但完整展示了 Flutter for OpenHarmony 项目中第三方库的使用流程。
后续可以在这个基础上继续扩展,例如:
- 添加真实消费记录输入;
- 添加本地数据保存;
- 添加月份切换;
- 添加折线图展示消费趋势;
- 添加预算提醒;
- 添加分类筛选;
- 添加导出报表;
- 添加暗色主题;
- 添加多图表切换;
- 添加年度消费统计。
整体来看,fl_chart 可以帮助 Flutter 开发者快速实现图表可视化。通过这个项目,可以理解 Flutter for OpenHarmony 中第三方库依赖配置、图表组件使用和数据可视化页面构建之间的基本关系。

开源鸿蒙跨平台开发社区汇聚开发者与厂商,共建“一次开发,多端部署”的开源生态,致力于降低跨端开发门槛,推动万物智联创新。
更多推荐

 6
6 0
0- 0


 已为社区贡献10条内容

所有评论(0)