Flutter for OpenHarmony 实战:记账应用数据统计与可视化
本文介绍了在Flutter for OpenHarmony平台上实现记账应用数据统计与可视化的关键技术。重点讲解了基础统计算法、分类汇总统计等核心功能实现,包括总余额计算、收支分类和时间维度分析。通过优化算法和空值处理确保统计准确性,并展示了如何将抽象数据转化为直观的图表展示。文章提供了完整的Dart代码示例,帮助开发者快速掌握记账应用的数据统计功能实现方法。
Flutter for OpenHarmony 实战:记账应用数据统计与可视化
摘要
欢迎加入开源鸿蒙跨平台社区:开源鸿蒙跨平台开发者社区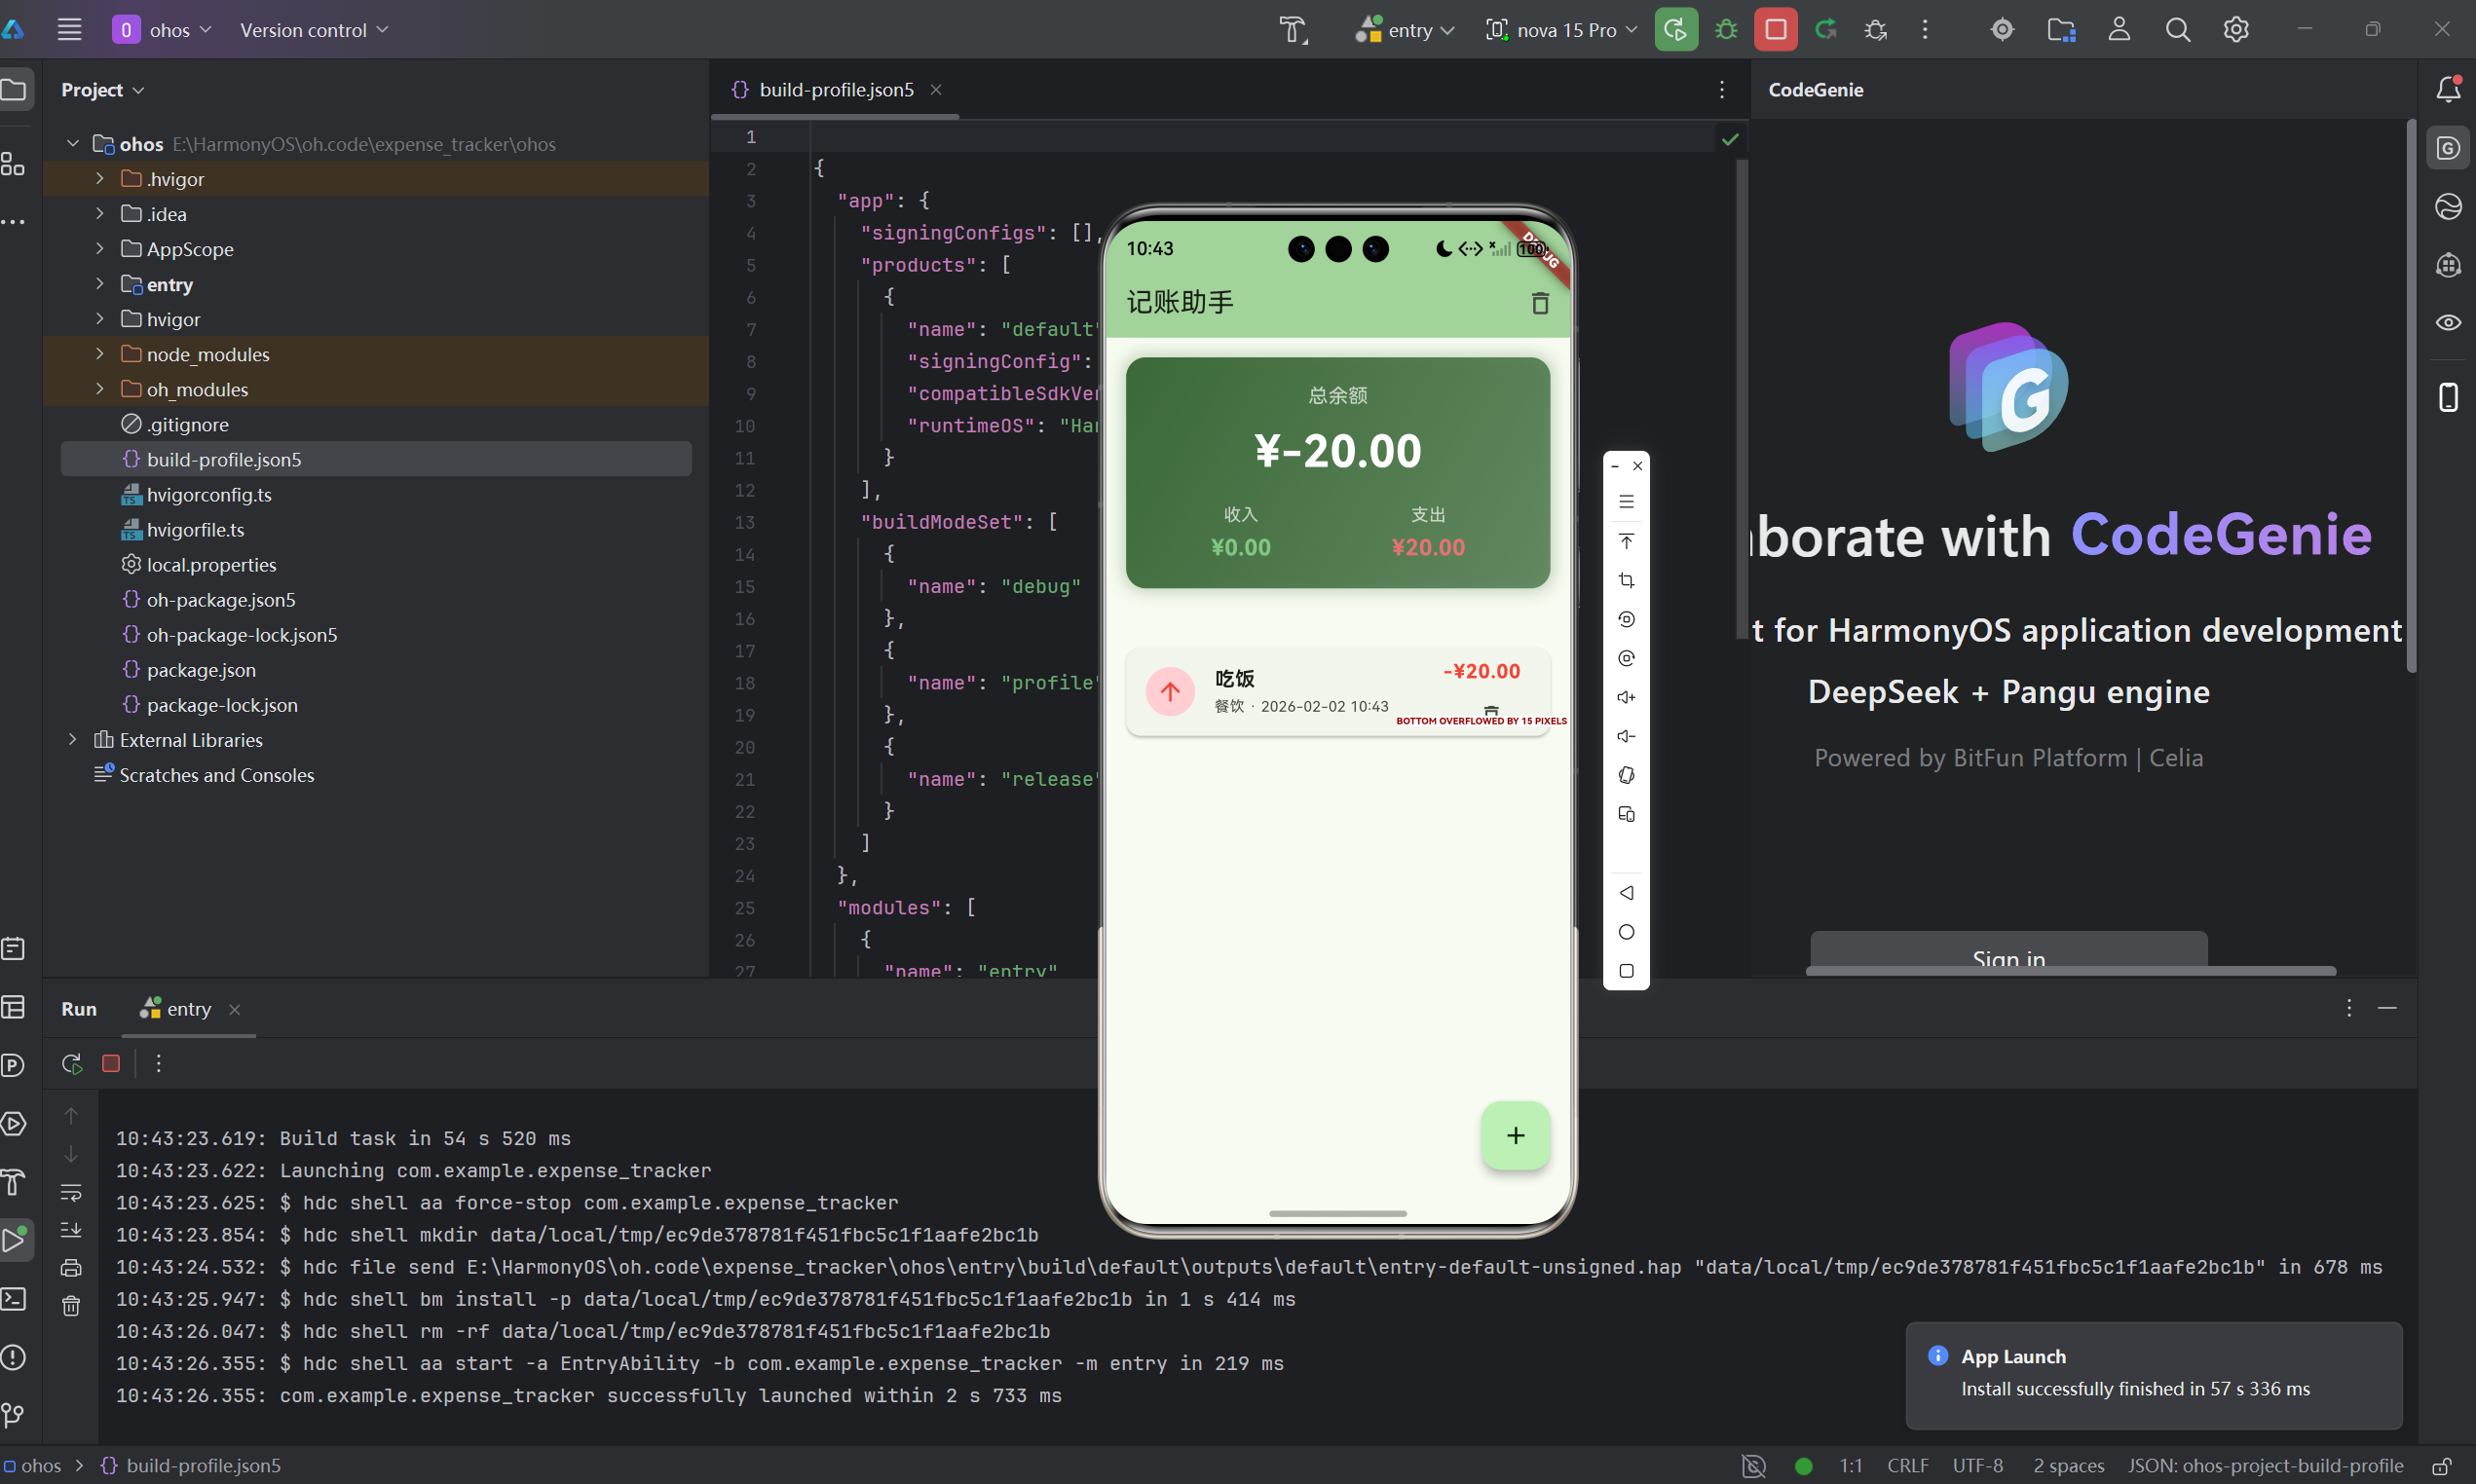
数据统计与可视化是记账应用的核心价值体现。本文将详细介绍如何在Flutter for OpenHarmony平台上实现记账应用的数据统计功能,包括收支计算、分类汇总、时间维度分析等核心技术点。通过本文学习,读者将掌握Dart语言的数据处理技巧,了解如何将抽象的数据转化为直观的图表展示。
一、数据可视化的重要性
1.1 为什么需要数据可视化
记账应用的核心价值不仅仅是记录收支,更重要的是通过数据分析帮助用户了解财务状况。
可视化的价值
- 快速了解收支情况
- 发现消费规律
- 辅助财务决策
- 增强用户体验
1.2 常见的统计维度
时间维度
- 日统计:当天的收支情况
- 周统计:本周的收支汇总
- 月统计:每月的收支对比
- 年统计:年度财务总览
分类维度
- 支出分类:各类支出占比
- 收入分类:各类收入来源
- 分类趋势:各分类的时间变化
金额维度
- 总余额:资产净值
- 收入总额:总收入统计
- 支出总额:总支出统计
- 收支比:收入支出比例
1.3 本项目实现的统计功能
| 统计类型 | 实现方式 | 展示形式 |
|---|---|---|
| 总余额 | 收入减支出 | 数字卡片 |
| 总收入 | 遍历累加 | 数字卡片 |
| 总支出 | 遍历累加 | 数字卡片 |
| 日收支统计 | 按日期分组 | 列表展示 |
二、数据统计算法实现
2.1 基础统计算法
最基础的统计是计算总余额、总收入和总支出:
void _calculateTotals() {
  // 初始化统计变量
  _totalIncome = 0;
  _totalExpense = 0;

  // 遍历所有交易记录
  for (var transaction in _transactions) {
    if (transaction.isExpense) {
      // 累加支出
      _totalExpense += transaction.amount;
    } else {
      // 累加收入
      _totalIncome += transaction.amount;
    }
  }

  // 计算余额
  _totalBalance = _totalIncome - _totalExpense;
}
算法分析
- 时间复杂度:O(n),n为交易记录数
- 空间复杂度:O(1),只使用固定数量的变量
- 适用场景:每次数据变化后重新计算
2.2 优化统计计算
使用reduce方法简化计算:
void _calculateTotalsOptimized() {
  // 使用reduce一次性计算
  final totals = _transactions.fold(
    {'income': 0.0, 'expense': 0.0},
    (Map<String, double> totals, transaction) {
      if (transaction.isExpense) {
        totals['expense'] = totals['expense']! + transaction.amount;
      } else {
        totals['income'] = totals['income']! + transaction.amount;
      }
      return totals;
    },
  );

  _totalIncome = totals['income']!;
  _totalExpense = totals['expense']!;
  _totalBalance = _totalIncome - _totalExpense;
}
2.3 空值处理
确保计算结果的准确性:
void _calculateTotals() {
  _totalIncome = 0;
  _totalExpense = 0;

  for (var transaction in _transactions) {
    // 确保金额不为空
    final amount = transaction.amount;
    if (amount <= 0) continue; // 跳过无效金额

    if (transaction.isExpense) {
      _totalExpense += amount;
    } else {
      _totalIncome += amount;
    }
  }

  // 处理精度问题
  _totalBalance = double.parse(
    (_totalIncome - _totalExpense).toStringAsFixed(2)
  );
}
三、分类统计功能
3.1 分类数据结构
设计分类统计的数据模型:
class CategorySummary {
  final String category;    // 分类名称
  final double total;       // 总金额
  final int count;          // 交易笔数
  final double percentage;  // 占比

  CategorySummary({
    required this.category,
    required this.total,
    required this.count,
    required this.percentage,
  });
}
3.2 按分类汇总
实现按分类汇总的统计方法:
List<CategorySummary> _calculateCategorySummary(bool isExpense) {
  final Map<String, double> categoryTotals = {};
  final Map<String, int> categoryCounts = {};
  double grandTotal = 0;

  // 统计每个分类的总金额和笔数
  for (var transaction in _transactions) {
    if (transaction.isExpense == isExpense) {
      final category = transaction.category;
      categoryTotals[category] =
          (categoryTotals[category] ?? 0) + transaction.amount;
      categoryCounts[category] =
          (categoryCounts[category] ?? 0) + 1;
      grandTotal += transaction.amount;
    }
  }

  // 生成分类汇总列表
  final summaries = categoryTotals.entries.map((entry) {
    return CategorySummary(
      category: entry.key,
      total: entry.value,
      count: categoryCounts[entry.key] ?? 0,
      percentage: grandTotal > 0
          ? (entry.value / grandTotal * 100)
          : 0,
    );
  }).toList();

  // 按金额降序排序
  summaries.sort((a, b) => b.total.compareTo(a.total));

  return summaries;
}
3.3 分类统计UI展示
展示分类统计结果:
Widget _buildCategorySummary(List<CategorySummary> summaries) {
  if (summaries.isEmpty) {
    return const Center(
      child: Text('暂无数据'),
    );
  }

  return Column(
    children: summaries.map((summary) {
      return Card(
        margin: const EdgeInsets.symmetric(vertical: 4, horizontal: 16),
        child: Padding(
          padding: const EdgeInsets.all(16),
          child: Column(
            crossAxisAlignment: CrossAxisAlignment.start,
            children: [
              // 分类名称
              Text(
                summary.category,
                style: const TextStyle(
                  fontSize: 16,
                  fontWeight: FontWeight.bold,
                ),
              ),
              const SizedBox(height: 8),

              // 金额和笔数
              Row(
                mainAxisAlignment: MainAxisAlignment.spaceBetween,
                children: [
                  Text(
                    '¥${summary.total.toStringAsFixed(2)}',
                    style: const TextStyle(
                      fontSize: 18,
                      fontWeight: FontWeight.bold,
                    ),
                  ),
                  Text(
                    '${summary.count}笔',
                    style: TextStyle(
                      fontSize: 14,
                      color: Colors.grey[600],
                    ),
                  ),
                ],
              ),
              const SizedBox(height: 8),

              // 占比进度条
              LinearProgressIndicator(
                value: summary.percentage / 100,
                backgroundColor: Colors.grey[200],
              ),
              const SizedBox(height: 4),

              // 占比文字
              Text(
                '占比: ${summary.percentage.toStringAsFixed(1)}%',
                style: const TextStyle(fontSize: 12),
              ),
            ],
          ),
        ),
      );
    }).toList(),
  );
}
四、时间维度数据分析
4.1 按日期分组统计
实现按日期分组的统计算法:
Map<String, CategorySummary> _calculateDailySummary() {
  final Map<String, double> dailyTotals = {};
  final Map<String, bool> dailyTypes = {};

  for (var transaction in _transactions) {
    // 提取日期部分作为key
    final dateKey = DateFormat('yyyy-MM-dd').format(transaction.date);

    dailyTotals[dateKey] =
        (dailyTotals[dateKey] ?? 0) + transaction.amount;
    dailyTypes[dateKey] = transaction.isExpense;
  }

  return dailyTotals;
}
4.2 按月分组统计
实现按月份分组的统计:
Map<String, Map<String, double>> _calculateMonthlySummary() {
  final Map<String, Map<String, double>> monthlyData = {};

  for (var transaction in _transactions) {
    // 提取年月作为key
    final monthKey = DateFormat('yyyy-MM').format(transaction.date);

    monthlyData.putIfAbsent(monthKey, () => {
      'income': 0.0,
      'expense': 0.0,
    });

    if (transaction.isExpense) {
      monthlyData[monthKey]!['expense'] =
          monthlyData[monthKey]!['expense']! + transaction.amount;
    } else {
      monthlyData[monthKey]!['income'] =
          monthlyData[monthKey]!['income']! + transaction.amount;
    }
  }

  return monthlyData;
}
4.3 日期范围筛选
实现按日期范围筛选的功能:
List<Transaction> _filterByDateRange(DateTime start, DateTime end) {
  return _transactions.where((transaction) {
    return transaction.date.isAfter(start.subtract(const Duration(days: 1))) &&
           transaction.date.isBefore(end.add(const Duration(days: 1)));
  }).toList();
}

// 使用示例
final now = DateTime.now();
final startOfMonth = DateTime(now.year, now.month, 1);
final endOfMonth = DateTime(now.year, now.month + 1, 0);

final monthlyTransactions = _filterByDateRange(startOfMonth, endOfMonth);
五、UI可视化展示
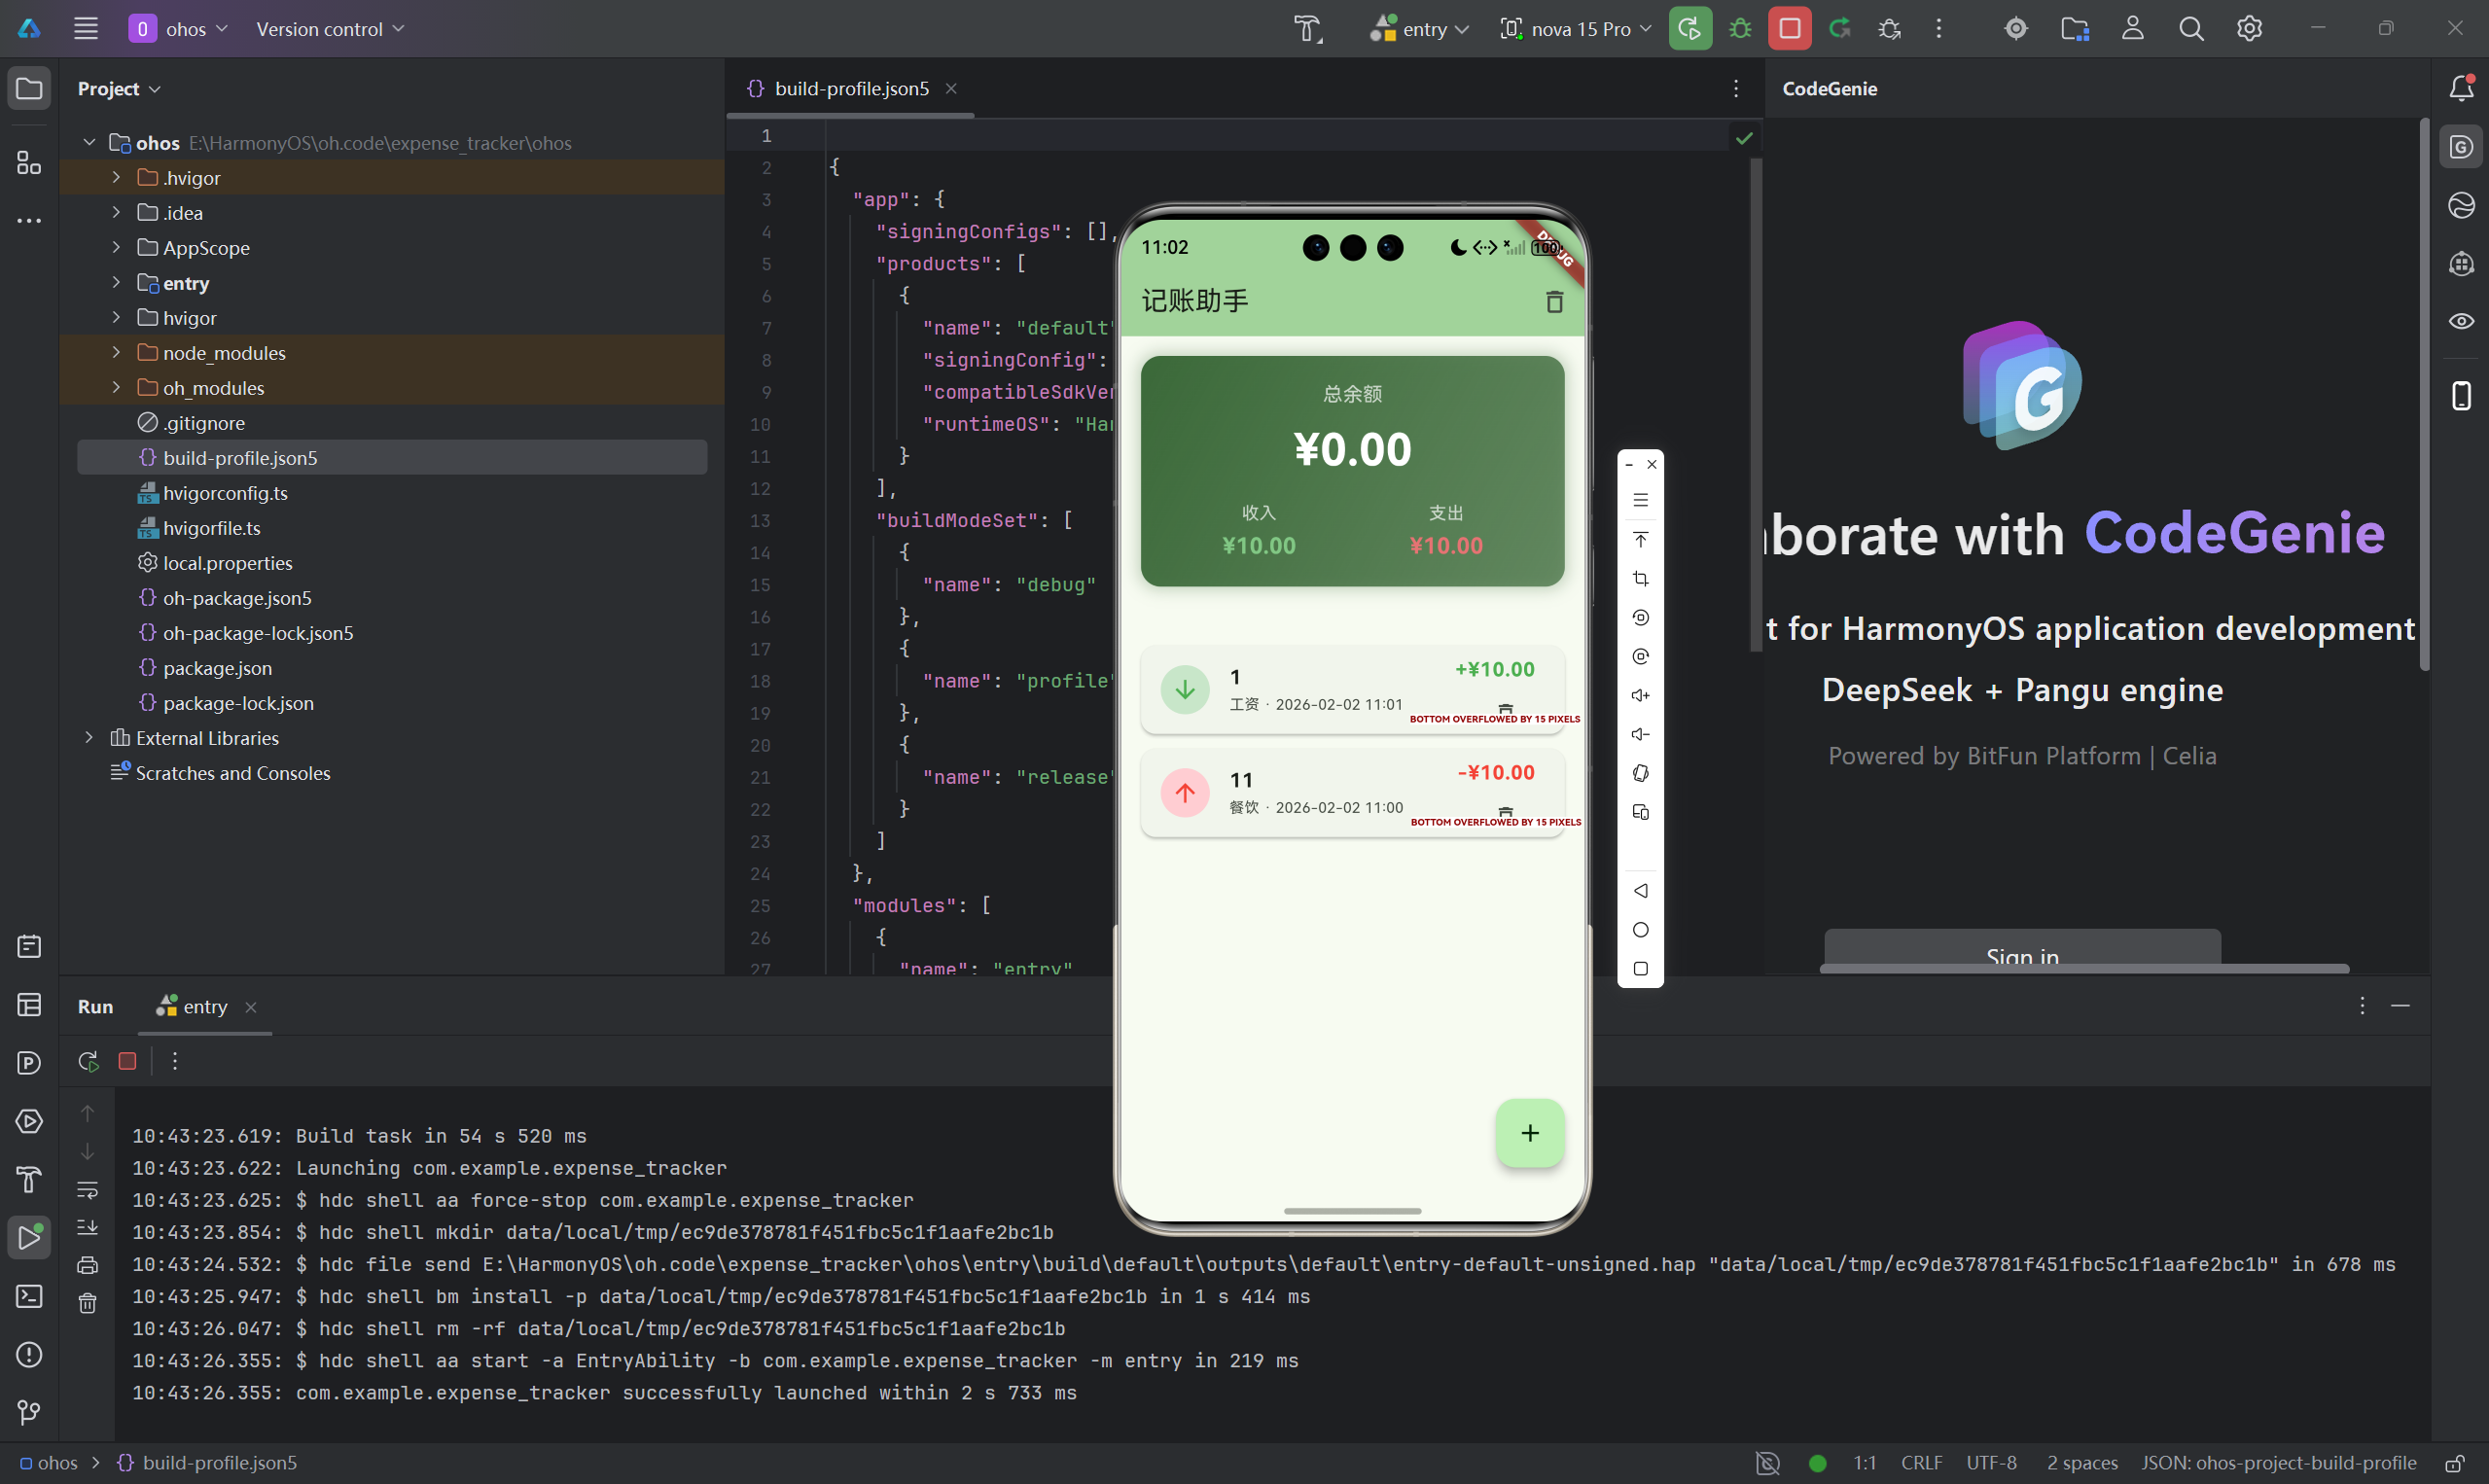
5.1 余额卡片设计
余额卡片是最直观的数据展示:
Widget _buildBalanceCard() {
  return Container(
    margin: const EdgeInsets.all(16),
    padding: const EdgeInsets.all(20),
    decoration: BoxDecoration(
      gradient: LinearGradient(
        begin: Alignment.topLeft,
        end: Alignment.bottomRight,
        colors: [
          Theme.of(context).colorScheme.primary,
          Theme.of(context).colorScheme.primary.withAlpha(179),
        ],
      ),
      borderRadius: BorderRadius.circular(16),
      boxShadow: [
        BoxShadow(
          color: Theme.of(context).colorScheme.primary.withAlpha(77),
          blurRadius: 10,
          spreadRadius: 2,
        ),
      ],
    ),
    child: Column(
      children: [
        const Text(
          '总余额',
          style: TextStyle(
            fontSize: 16,
            color: Colors.white70,
          ),
        ),
        const SizedBox(height: 8),

        // 余额显示
        Text(
          '¥${_totalBalance.toStringAsFixed(2)}',
          style: const TextStyle(
            fontSize: 36,
            fontWeight: FontWeight.bold,
            color: Colors.white,
          ),
        ),
        const SizedBox(height: 16),

        // 收支对比
        Row(
          mainAxisAlignment: MainAxisAlignment.spaceAround,
          children: [
            _buildSummaryItem(
              '收入',
              '¥${_totalIncome.toStringAsFixed(2)}',
              Colors.green[300]!,
            ),
            _buildSummaryItem(
              '支出',
              '¥${_totalExpense.toStringAsFixed(2)}',
              Colors.red[300]!,
            ),
          ],
        ),
      ],
    ),
  );
}

Widget _buildSummaryItem(String label, String value, Color color) {
  return Column(
    children: [
      Text(
        label,
        style: const TextStyle(
          fontSize: 14,
          color: Colors.white70,
        ),
      ),
      const SizedBox(height: 4),
      Text(
        value,
        style: TextStyle(
          fontSize: 18,
          fontWeight: FontWeight.bold,
          color: color,
        ),
      ),
    ],
  );
}
5.2 收支比例展示
使用圆形进度条展示收支比例:
Widget _buildIncomeExpenseRatio() {
  final total = _totalIncome + _totalExpense;
  if (total == 0) return const SizedBox();

  final incomeRatio = _totalIncome / total;
  final expenseRatio = _totalExpense / total;

  return Card(
    margin: const EdgeInsets.all(16),
    child: Padding(
      padding: const EdgeInsets.all(16),
      child: Column(
        crossAxisAlignment: CrossAxisAlignment.start,
        children: [
          const Text(
            '收支比例',
            style: TextStyle(
              fontSize: 18,
              fontWeight: FontWeight.bold,
            ),
          ),
          const SizedBox(height: 16),

          // 收入比例
          _buildRatioBar('收入', incomeRatio, Colors.green),
          const SizedBox(height: 12),

          // 支出比例
          _buildRatioBar('支出', expenseRatio, Colors.red),
        ],
      ),
    ),
  );
}

Widget _buildRatioBar(String label, double ratio, Color color) {
  return Column(
    crossAxisAlignment: CrossAxisAlignment.start,
    children: [
      Row(
        mainAxisAlignment: MainAxisAlignment.spaceBetween,
        children: [
          Text(label),
          Text('${(ratio * 100).toStringAsFixed(1)}%'),
        ],
      ),
      const SizedBox(height: 8),
      LinearProgressIndicator(
        value: ratio,
        backgroundColor: Colors.grey[200],
        valueColor: AlwaysStoppedAnimation<Color>(color),
      ),
    ],
  );
}
5.3 列表排序展示
支持多种排序方式:
enum SortType {
  dateDesc,    // 按日期降序
  dateAsc,     // 按日期升序
  amountDesc,  // 按金额降序
  amountAsc,   // 按金额升序
}

List<Transaction> _sortTransactions(List<Transaction> transactions, SortType sortType) {
  final sorted = List<Transaction>.from(transactions);

  switch (sortType) {
    case SortType.dateDesc:
      sorted.sort((a, b) => b.date.compareTo(a.date));
      break;
    case SortType.dateAsc:
      sorted.sort((a, b) => a.date.compareTo(b.date));
      break;
    case SortType.amountDesc:
      sorted.sort((a, b) => b.amount.compareTo(a.amount));
      break;
    case SortType.amountAsc:
      sorted.sort((a, b) => a.amount.compareTo(b.amount));
      break;
  }

  return sorted;
}
六、高级统计功能
6.1 月度对比分析
实现不同月份的收支对比:
Map<String, Map<String, double>> _getMonthlyComparison() {
  final now = DateTime.now();
  final thisMonth = DateFormat('yyyy-MM').format(now);
  final lastMonth = DateFormat('yyyy-MM').format(
    DateTime(now.year, now.month - 1, 1)
  );

  final monthlyData = _calculateMonthlySummary();

  return {
    '本月': monthlyData[thisMonth] ?? {'income': 0.0, 'expense': 0.0},
    '上月': monthlyData[lastMonth] ?? {'income': 0.0, 'expense': 0.0},
  };
}
6.2 平均消费计算
计算平均每日支出:
double _calculateAverageDailyExpense() {
  if (_transactions.isEmpty) return 0;

  // 获取最早的交易日期
  final firstDate = _transactions
      .map((t) => t.date)
      .reduce((a, b) => a.isBefore(b) ? a : b);

  final days = DateTime.now().difference(firstDate).inDays + 1;
  return _totalExpense / days;
}
6.3 最大支出记录
查找单笔最大支出:
Transaction? _getLargestExpense() {
  final expenses = _transactions.where((t) => t.isExpense).toList();
  if (expenses.isEmpty) return null;

  expenses.sort((a, b) => b.amount.compareTo(a.amount));
  return expenses.first;
}
七、总结
本文详细介绍了记账应用的数据统计与可视化实现,主要内容包括:
- 基础统计:实现收入、支出、余额的计算
- 分类统计:按分类汇总和占比分析
- 时间统计:按日期、月份分组统计
- UI展示:直观的数据可视化界面
- 高级功能:月度对比、平均值计算等
数据统计是记账应用的核心价值,通过合理的数据处理和可视化展示,可以帮助用户更好地了解财务状况,做出明智的消费决策。这些统计技巧同样适用于其他类型的数据分析应用。
欢迎加入开源鸿蒙跨平台社区: 开源鸿蒙跨平台开发者社区

开源鸿蒙跨平台开发社区汇聚开发者与厂商,共建“一次开发,多端部署”的开源生态,致力于降低跨端开发门槛,推动万物智联创新。
更多推荐

 33
33 0
0- 0


 已为社区贡献84条内容

所有评论(0)