Proxmox ve(PVE) 显示CPU温度、NVME硬盘温度、主板温度(三种方式)
·
文章目录
一、InfluxDB方式
1.先上效果
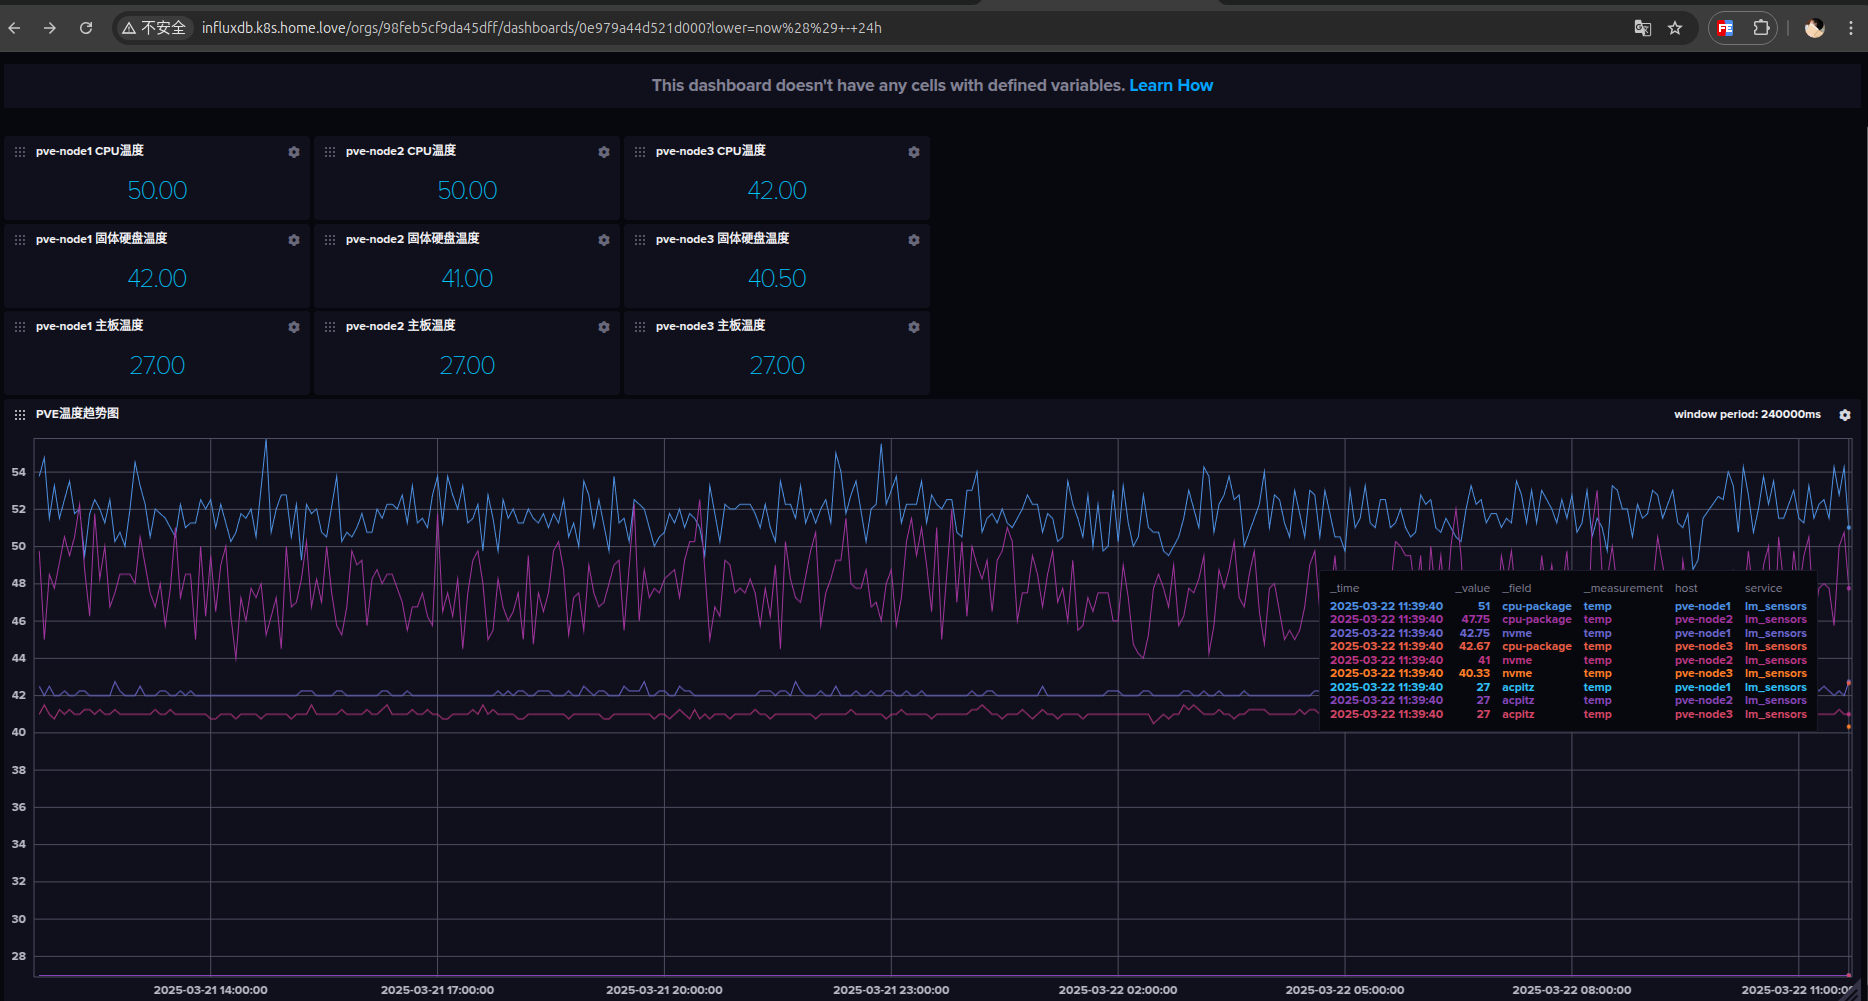
2.安装InfluxDB
# https://artifacthub.io/packages/helm/bitnami/influxdb
helm repo add bitnami https://charts.bitnami.com/bitnami
helm upgrade --install -n db --create-namespace influxdb bitnami/influxdb -n db -f values.yaml
2.1 配置traefik
# https://doc.traefik.io/traefik/reference/routing-configuration/kubernetes/crd/http/ingressroute/
apiVersion: traefik.io/v1alpha1
kind: IngressRoute
metadata:
  name: traefik-host
  namespace: db
spec:
  entryPoints:
    - web
  routes:
    - match: "Host(`influxdb.k8s.home.love`)"
      kind: Rule
      services:
        - name: influxdb
          port: 8086
2.2 修改密码
# https://docs.influxdata.com/influxdb/v2/admin/users/change-password/
influx user password --name admin --password dhm1234. --token xvxwDFspp8pvLXRHIV3V
3.安装温度监控软件
https://github.com/MightySlaytanic/pve-monitoring
apt install lm-sensors
# 一路yes,最后再enter
sensors-detect
sensors -j
3.1 安装python环境
mkdir sensors
cd sensors
apt install python3.11-venv
python3 -m venv .venv
source .venv/bin/activate
pip install influxdb_client
3.2 python脚本
pve_temp_stats_to_influxdb2.py
#!/root/scripts/venv/bin/python3

# Note about python shabang string above: if you're running on a Debian 11
# system use the standard "#!/usr/bin/python3" string while if you are on
# a Debian 12 system you need to create a virtual-env with influxdb_client
# and use the shabang string pointing to the python3 interpreter within
# the virtual-env, such as "#!/root/scripts/venv/bin/python3"
#
# For example, to create the virtual-env in /root/scripts/venv and install
# the required package do the following:
#
# python3 -m venv /root/scripts/venv
# . /root/scripts/venv/bin/activate
# pip3 install influxdb-client
# deactivate

import re
import sys
import json
import argparse
from datetime import datetime
from os import getenv
from subprocess import run,PIPE

from influxdb_client import InfluxDBClient
from influxdb_client.client.write_api import SYNCHRONOUS
from influxdb_client.client.exceptions import InfluxDBError

INFLUX_HOST = getenv("INFLUX_HOST")
INFLUX_PORT = getenv("INFLUX_PORT")
INFLUX_TOKEN = getenv("INFLUX_TOKEN")
INFLUX_ORGANIZATION = getenv("INFLUX_ORGANIZATION")
INFLUX_BUCKET = getenv("INFLUX_BUCKET")
HOST = getenv("HOST_TAG")
CPU_CORES = int(getenv("CPU_CORES"))

CORE_OFFSET=2

CORETEMP_NAME = getenv("CORETEMP_NAME")
PCH_INFO = getenv("PCH_INFO").split(':')
ACPITZ_INFO = getenv("ACPITZ_INFO").split(':')

NVME_INFO = []
for nvme_item in getenv("NVME_INFO").split(','):
    NVME_INFO.append(nvme_item.split(':'))


if __name__ == '__main__':
    parser = argparse.ArgumentParser(usage="PVE Sensors Stats to influxdb2 uploader")

    parser.add_argument(
        "-t",
        "--test",
        help="Just print the results without uploading to influxdb2",
        action="store_true"
    )

    args = parser.parse_args()

    measurements = []
    stats = {}

    data = json.loads(run(["/usr/bin/sensors -j"], stdout=PIPE, stderr=None, text=True, shell=True).stdout)

    if CORETEMP_NAME:
        stats["cpu-package"] = int(data[CORETEMP_NAME]["Package id 0"]["temp1_input"])
        for index in range(0,CPU_CORES):
            stats[f"core{index}"] = int(data[CORETEMP_NAME][f"Core {index}"][f"temp{index+CORE_OFFSET}_input"])

#    if PCH_INFO[0]:
 #       stats[PCH_INFO[0]] = int(data[PCH_INFO[1]][PCH_INFO[2]][PCH_INFO[3]])

    if ACPITZ_INFO[0]:
        stats[ACPITZ_INFO[0]] = int(data[ACPITZ_INFO[1]][ACPITZ_INFO[2]][ACPITZ_INFO[3]])

    if NVME_INFO[0]:
        for nvme_item in NVME_INFO:
            if nvme_item[0]:
                stats[nvme_item[0]] = int(data[nvme_item[1]][nvme_item[2]][nvme_item[3]])

    measurements.append({
        "measurement": "temp",
        "tags": {"host": HOST, "service": "lm_sensors"},
        "fields": stats
    })

    if args.test:
        print(f"\nMeasurements for host {HOST}")
        print(json.dumps(measurements, indent=4))
    else:
        try:
            client = InfluxDBClient(url=f"{INFLUX_HOST}:{INFLUX_PORT}", token=INFLUX_TOKEN, org=INFLUX_ORGANIZATION, timeout=30000)
            write_api = client.write_api(write_options=SYNCHRONOUS)

            write_api.write(
                INFLUX_BUCKET,
                INFLUX_ORGANIZATION,
                measurements
            )

        except TimeoutError as e:
            failure = True
            print(e,file=sys.stderr)
            print(f"[{datetime.now().strftime('%Y-%m-%d %H:%M:%S')}] TimeoutError: Could not upload data to {INFLUX_HOST}:{INFLUX_PORT} for host {HOST}",file=sys.stderr)
            exit(-1)
        except InfluxDBError as e:
            failure = True
            print(e,file=sys.stderr)
            print(f"[{datetime.now().strftime('%Y-%m-%d %H:%M:%S')}] InfluxDBError: Could not upload data to {INFLUX_HOST}:{INFLUX_PORT} for host {HOST}",file=sys.stderr)
            exit(-1)
        except Exception as e:
            failure = True
            print(e, file=sys.stderr)
            print(f"[{datetime.now().strftime('%Y-%m-%d %H:%M:%S')}] Connection Error: Could not upload data to {INFLUX_HOST}:{INFLUX_PORT} for host {HOST}",file=sys.stderr)
            exit(-1)

        client.close()
3.3 shell脚本
pve_temp_stats_to_influxdb2.sh
#!/bin/bash

export INFLUX_HOST="http://influxdb.k8s.home.love"
export INFLUX_PORT="80"
export INFLUX_ORGANIZATION="primary"
export INFLUX_BUCKET="proxmox"
export INFLUX_TOKEN="xvxwDFspp8pvLXRHIV3V"
export HOST_TAG="pve-node1"
export CPU_CORES="8"

# Execute "sensors -j" and then use the information to set the following environment variables.
# In case some of them, like ACPITZ stuff, are not available, set them to ""
# For example if you want the PCH temperature to be stored in a pch field and you see the following
# within "sensors -j" output
#   "pch_cannonlake-virtual-0":{
#      "Adapter": "Virtual device",
#      "temp1":{
#         "temp1_input": 61.000
#      }
#   }
# Set PCH_INFO as the following, by looking at the chain of values that lead to the temperature of PCH
export PCH_INFO="pch:pch_cannonlake-virtual-0:temp1:temp1_input"

# The same as above
export ACPITZ_INFO="acpitz:acpitz-acpi-0:temp1:temp1_input"

# The same as above, but if you have multiple nvme entries you can define them as below, using "," to
# separate the column-separated info of the different nvme disks
export NVME_INFO="nvme:nvme-pci-0500:Composite:temp1_input"

# This is simply the name of the coretemp-* value in "sensors -j" output
export CORETEMP_NAME="coretemp-isa-0000"

# Debian 11 without Python Virtual Environment
# python3 /home/scripts/pve_temp_stats_to_influxdb2.py $*

# Debian 12 with Python Virtual Environment in /path/to/venv
/root/sensors/.venv/bin/python3 /root/sensors/pve_temp_stats_to_influxdb2.py $*
别忘记添加执行权限
chmod +x pve_temp_stats_to_influxdb2.sh
3.4 创建定时任务
nano /etc/cron.d/influx_stats

# Upload stats to InfluxDB2

* * * * * root /root/sensors/pve_temp_stats_to_influxdb2.sh >/dev/null 2>&1
二、pvetools方式
1.安装
https://github.com/ivanhao/pvetools
sver=`cat /etc/os-release|grep VERSION_CODENAME|awk -F '=' '{print $2}'` && echo "nameserver 8.8.8.8" >> /etc/resolv.conf && rm -rf pvetools && echo "deb http://mirrors.ustc.edu.cn/proxmox/debian/pve/ $sver pve-no-subscription" > /etc/apt/sources.list.d/pve-no-sub.list && sed -i 's|deb|#deb|' /etc/apt/sources.list.d/pve-enterprise.list && echo "" > /etc/apt/sources.list.d/ceph.list && export LC_ALL=en_US.UTF-8 && apt update && apt -y install git && git clone https://github.com/ivanhao/pvetools.git && echo "cd /root/pvetools && ./pvetools.sh" > pvetools/pvetools && chmod +x pvetools/pvetools* && ln -s /root/pvetools/pvetools /usr/local/bin/pvetools && pvetools
2.配置

3.效果

三、直接改代码方式
【Proxmox ve(PVE) 显示CPU和硬盘温度、UPS信息 - CSDN App】
四、进阶:接入Metric Server
1.pve接入InfluxDB
Server: influxdb.k8s.home.love
Organization: primary
Port: 80
Bucket: proxmox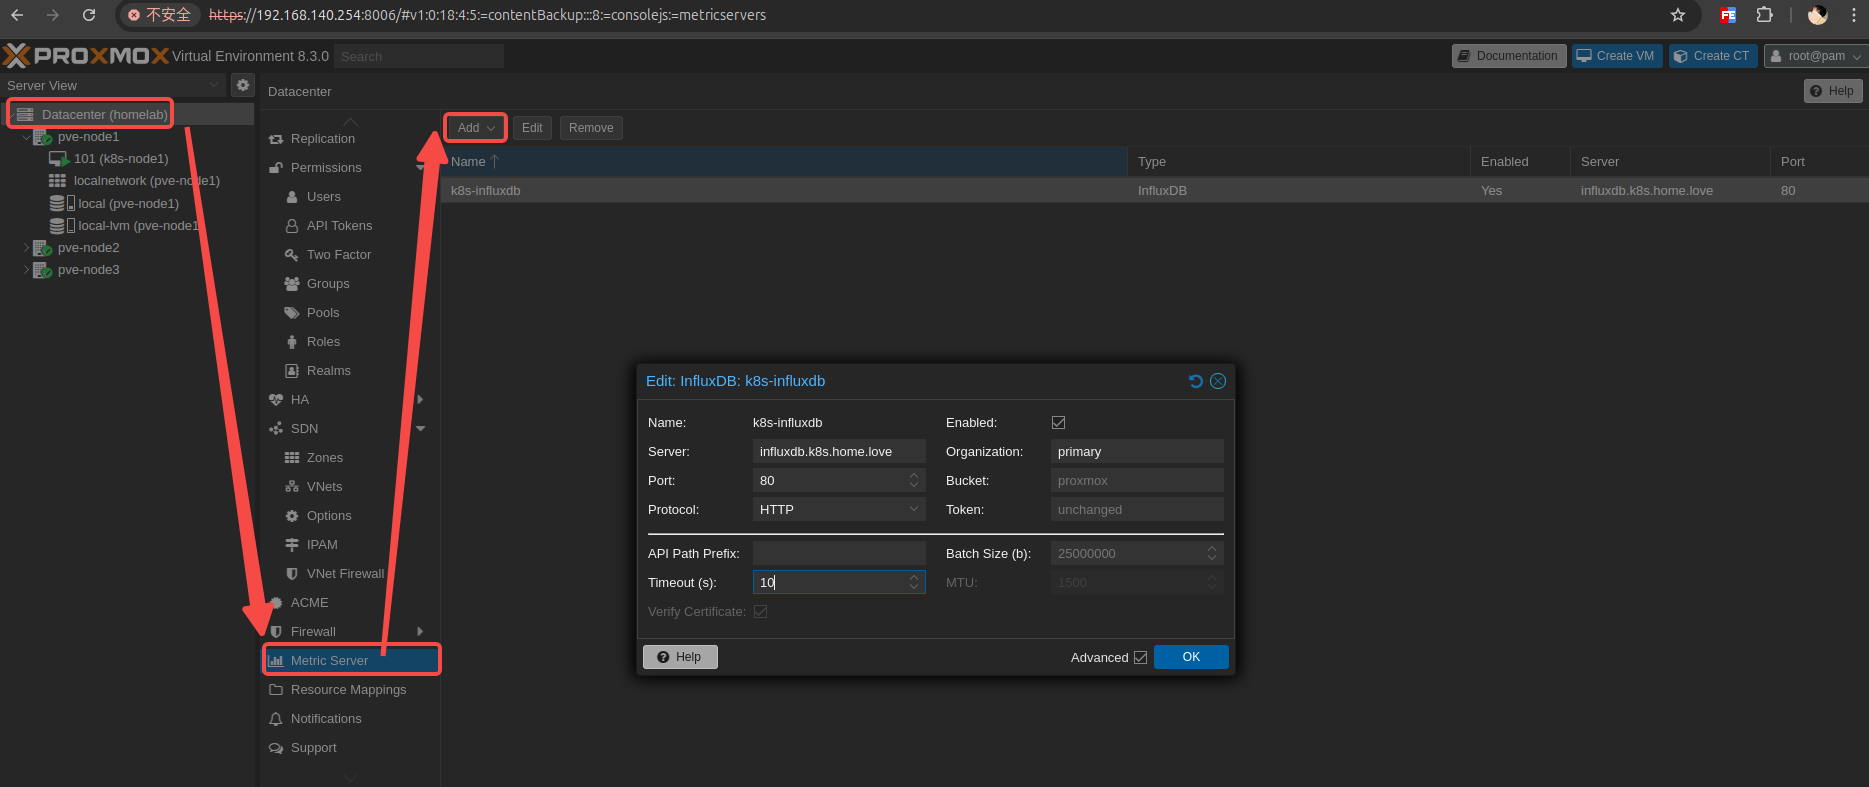
2.看板配置
https://gitee.com/duhongming/homelab/tree/master/apps/influxdb

开源鸿蒙跨平台开发社区汇聚开发者与厂商,共建“一次开发,多端部署”的开源生态,致力于降低跨端开发门槛,推动万物智联创新。
更多推荐

 10
10 0
0- 0


 已为社区贡献3条内容

所有评论(0)