echarts图例配置第一时间并未生效的处理方式,并认识requestAnimationFrame
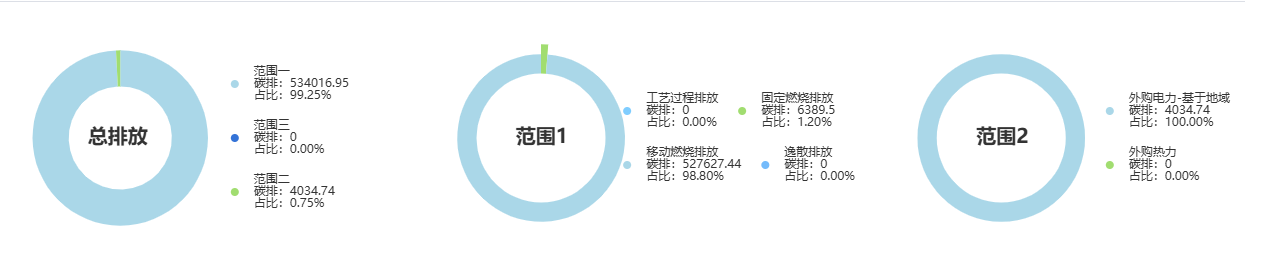
因为都是环形图,封装了一个环形图的组件使用,并配置了图例的显示位置,超过三条数据后,两个为一组进行折行处理,但是宽度的设置,在首次加载的时期并没有直接生效
组件如下
<template>
<div
v-loading="loading"
ref="chartContainer"
:class="['pieChart', { pieChartless: pieChartless }]"
></div>
</template>
<script>
export default {
props: {
pieData: {
type: Array,
default: () => []
},
chartType: {
type: String,
default: ""
}
},
data() {
return {
pieChartless: false,
loading: true,
myChart: null
};
},
watch: {
pieData: {
deep: true,
handler(newVal) {
this.loading = !newVal.length;
this.$nextTick(() => {
this.pieChartless = newVal.length > 3;
this.initNewChart();
});
},
immediate: true
}
},
mounted() {
this.pieData.length > 3
? (this.pieChartless = true)
: (this.pieChartless = false);
this.loading = !this.pieData.length; // 初始化 loading 状态
this.$nextTick(() => {
if (newVal && newVal.length) {
this.initNewChart(); // 确保使用最新数据
}
});
},
methods: {
renderPieChart(containerId, data, chartType) {
const chartDom = containerId;
if (!chartDom) return;
const myChart = echarts.init(chartDom);
this.myChart = myChart;
let total = data.reduce((sum, item) => sum + item.value, 0);
// 根据数据量决定图例排列方式
const isFewItems = data.length <= 3;
const isTotalEmission = chartType === "总排放";
// 设置饼图半径和中心位置
let radius, center;
if (isTotalEmission) {
radius = ["40%", "68%"];
center = ["35%", "50%"];
} else {
radius = ["50%", "65%"];
center = ["35%", "50%"];
}
// 自定义图例格式化内容
const legendFormatter = name => {
let item = data.find(d => d.name === name);
if (!item) return "";
return `${item.name}\n碳排:${item.value}\n占比:${(
(item.value / total) *
100
).toFixed(2)}%`;
};
// 图例配置
const legendConfig = {
show: true,
orient: isFewItems || isTotalEmission ? "vertical" : "horizontal",
right: isFewItems || isTotalEmission ? 0 : 0,
top: isFewItems || isTotalEmission ? "center" : "center",
bottom: isFewItems || isTotalEmission ? undefined : 10,
itemGap: 10,
// width: isFewItems || isTotalEmission ? undefined : "80%",
// width: isFewItems ? "30%" : "49%",
width: "100%",
formatter: legendFormatter,
textStyle: {
padding: [4, 10],
lineHeight: 18,
fontSize: 12
},
icon: "circle",
itemStyle: {
borderWidth: 0
},
itemWidth: 8,
itemHeight: 8,
rich: {
legendItem: {
width: 90, // 每一项图例的宽度
padding: [4, 6],
backgroundColor: "rgba(255,255,255,0.1)"
}
}
};
// 当数据>3且不是总排放时,设置每行显示2个图例项
if (!isFewItems && !isTotalEmission) {
legendConfig.pageButtonItemGap = 5;
legendConfig.pageButtonGap = 10;
legendConfig.pageButtonPosition = "end";
legendConfig.pageIconSize = 12;
legendConfig.pageTextStyle = {
color: "#333",
fontSize: 12
};
// 强制每行显示2个项目
legendConfig.itemGap = 10; // 调整图例项间距
// legendConfig.width = "80%"; // 限制图例宽度,确保自动换行
}
if (!isFewItems && !isTotalEmission) {
legendConfig.width = "50%"; // 控制最大宽度,让浏览器自动换行
}
let option = {
graphic: {
elements: [
{
type: "text",
shape: { text: chartType },
key: "centerText",
style: {
textAlign: "center",
fill: "#333",
fontSize: 16,
fontWeight: "bold"
},
left: "center",
top: "center",
z: 100, // 确保在最上层
bounding: "raw", // 避免文本被裁剪
style: {
width: 100, // 明确宽度
height: 20 // 明确高度
}
}
]
},
title: {
text: chartType,
// left: isTotalEmission ? "25%" : "29%",
left: isTotalEmission ? "25%" : chartType == "范围1" ? "29%" : "27%",
top: "center",
textStyle: {
fontSize: 20,
fontWeight: "bold",
color: "#333"
}
},
legend: legendConfig,
series: [
{
type: "pie",
radius: radius,
center: center,
avoidLabelOverlap: false,
label: { show: false },
labelLine: { show: false },
data: data.map(item => ({
name: item.name,
value: item.value,
itemStyle: { color: item.color }
}))
}
]
};
myChart.setOption(option, true);
this.$nextTick(() => {
requestAnimationFrame(() => {
myChart.resize();
});
});
// 👇 添加 resize 强制刷新布局
window.addEventListener("resize", () => {
myChart.resize();
});
// 初始也执行一次 resize,解决首次不生效问题
myChart.resize();
},
initNewChart() {
this.renderPieChart(
this.$refs.chartContainer,
this.pieData,
this.chartType
);
}
}
};
</script>
<style lang="scss" scoped>
.pieChart {
width: 375px;
height: 258px;
}
.pieChartless {
width: 506px;
height: 258px;
}
</style>
🧾 问题描述
在使用 ECharts 渲染饼图时,通过
pieChartless类名将图表容器宽度设置为506px,但在实际渲染中,ECharts 生成的<canvas>元素宽度仍为375px,未随容器变化。
🔍 原因分析
✅ 当前逻辑梳理:
- 使用了 Vue 的
$nextTick()确保 DOM 更新后再初始化或重绘图表。 - 使用了
echarts.init(this.$refs.chartContainer)初始化图表。 - 使用了
myChart.resize()来尝试适配容器尺寸。
❌ 问题根源:
-
DOM 尺寸尚未更新完成
- 即使调用了
$nextTick(),某些场景下 DOM 的最终布局仍未计算完成。 - 导致
echarts.init()获取到的是旧的容器尺寸(如:375px)。
- 即使调用了
-
ECharts 实例未正确响应容器变化
- 图表实例一旦初始化完成,其内部 canvas 尺寸不会自动响应外部容器的变化。
- 必须手动调用
myChart.resize()才能重新计算画布大小。
-
resize 调用时机不对
- 若在
renderPieChart中直接调用myChart.resize(),可能仍处于 DOM 更新流程中,导致 resize 生效失败
- 若在
方法:延迟执行 resize(推荐)
this.$nextTick(() => { requestAnimationFrame(() => { if (this.myChart) { this.myChart.resize(); } }); });
原理说明:
$nextTick():确保 Vue 数据更新后的 DOM 已渲染。requestAnimationFrame():确保浏览器下一次重绘前再执行 resize,此时 DOM 已完成布局。
requestAnimationFrame 是浏览器提供的一个用于执行动画或需要在页面重绘之前执行操作的 API。它告诉浏览器你希望执行一个动画,并请求浏览器在下一次重绘之前调用指定的回调函数。
✅ requestAnimationFrame 的作用
| 特性 | 描述 |
|---|---|
| 🖼️ 同步渲染 | 在浏览器下一次重绘前执行,确保 DOM 更新后立即生效 |
| ⏱️ 高性能 | 自动优化频率(通常每秒 60 次),与屏幕刷新率同步 |
| 🧠 节能省电 | 浏览器可以智能暂停空标签页中的动画以节省资源 |
🔄 替代 setTimeout(fn, 0) | 更适合处理 DOM 布局、尺寸获取等依赖渲染状态的操作 |
📌 使用场景举例
requestAnimationFrame(() => { // 这里的代码会在下一次浏览器绘制前执行 console.log('DOM 已更新,现在可以安全地读取尺寸'); });
在你的 ECharts 场景中适用的问题:
- 问题: 图表容器宽度已变(如类名
.pieChartless),但echarts.init()初始化时仍使用旧的宽高。 - 解决方式:
js
this.$nextTick(() => { requestAnimationFrame(() => { this.initNewChart(); // 确保在 DOM 渲染完成后初始化图表 }); });
🔁 与 $nextTick 的区别
| 方法 | 作用 | 是否等待 DOM 渲染完成 | 应用场景 |
|---|---|---|---|
$nextTick() | Vue 数据更新后触发回调 | ✅ 是 | DOM 更新后的逻辑处理 |
requestAnimationFrame | 浏览器下一次重绘前触发 | ✅ 是 | 动画、DOM 尺寸计算、ECharts resize |
开源鸿蒙跨平台开发社区汇聚开发者与厂商,共建“一次开发,多端部署”的开源生态,致力于降低跨端开发门槛,推动万物智联创新。
更多推荐
 36
36 0
0- 0


 已为社区贡献1条内容

所有评论(0)