Flutter for OpenHarmony生活助手App实战:支出分析图表实现
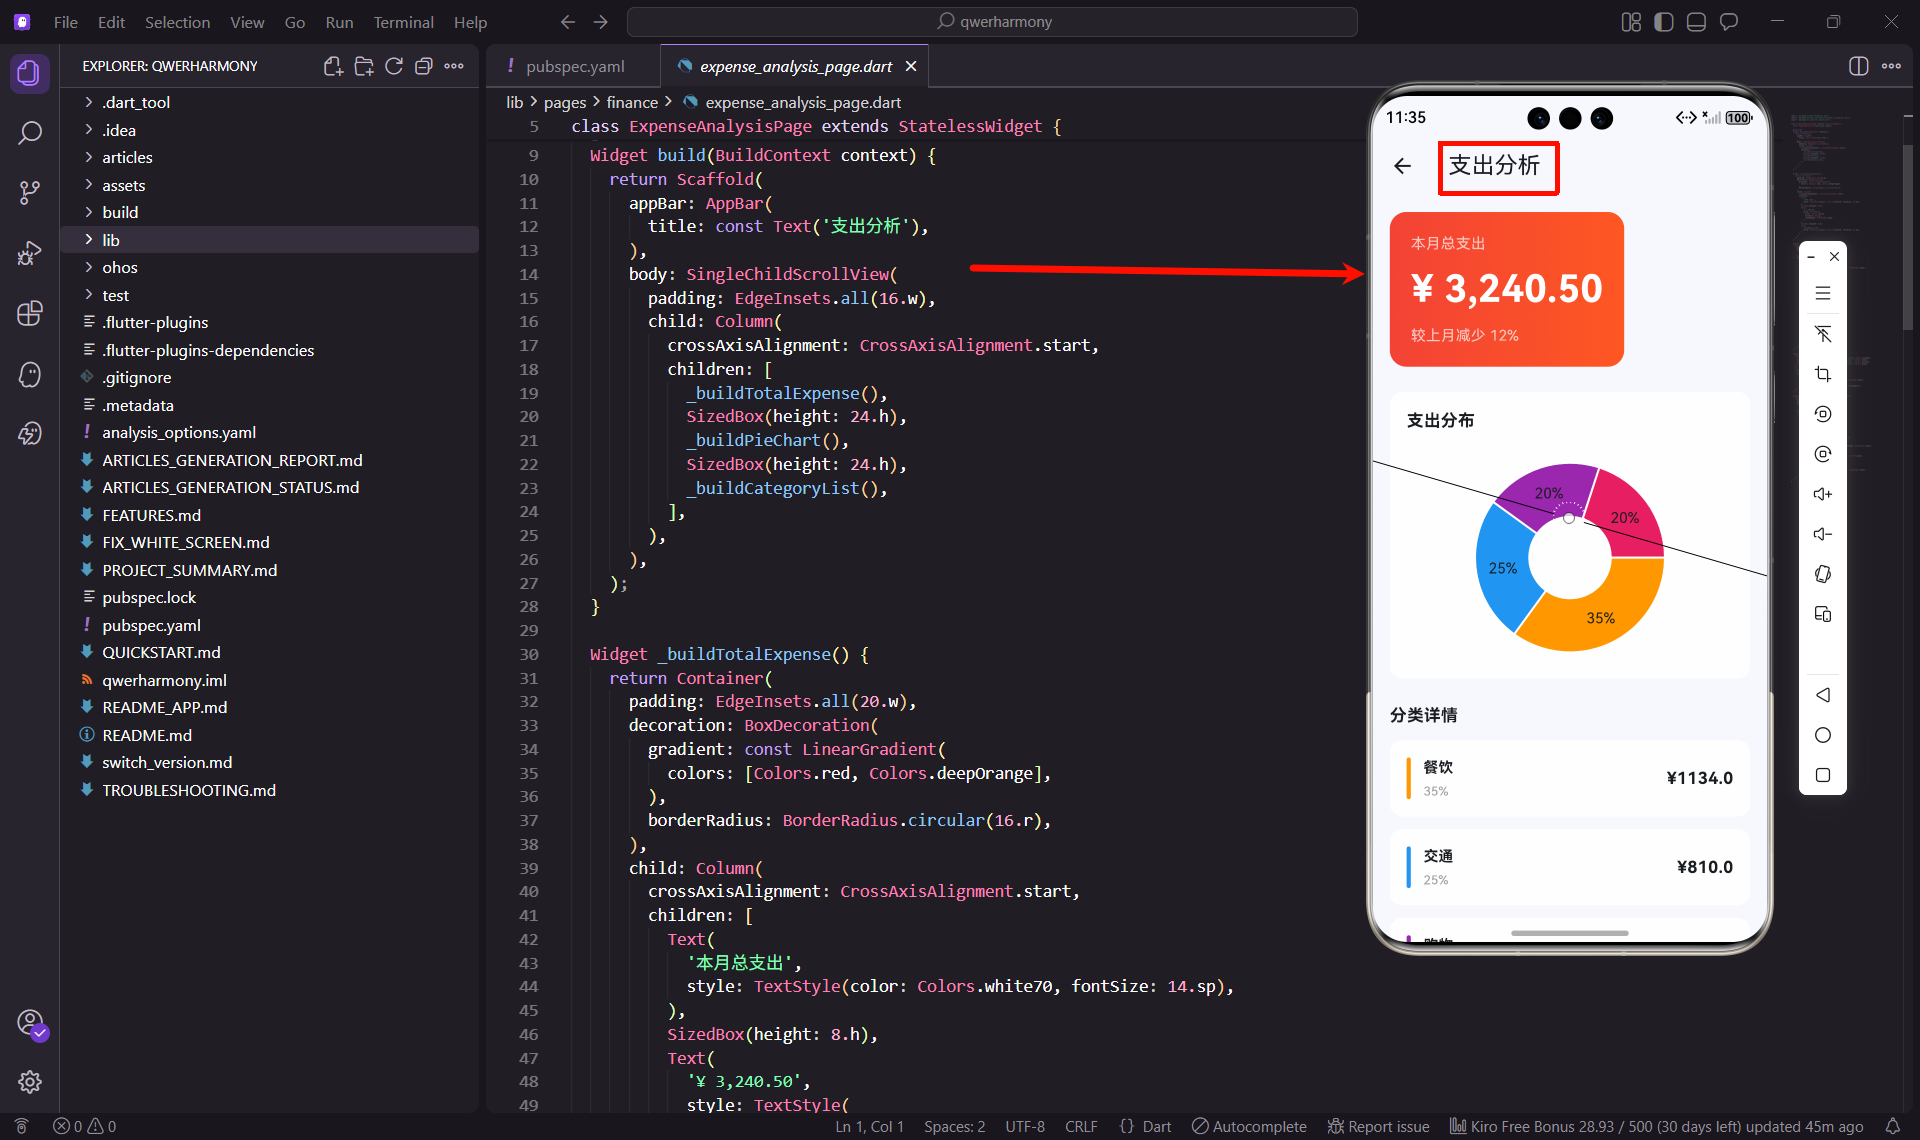
摘要 本文介绍了支出分析功能的设计与实现,强调了可视化分析对财务管理的重要性。文章展示了采用Flutter框架开发的支出分析页面,包含三个核心模块:总支出概览卡片(红色渐变设计突出支出)、环形饼图(直观展示消费分类占比)和分类详情列表(补充具体数据)。通过代码示例详细说明了各模块的实现方式,包括UI布局、数据展示和交互设计。这种图表结合数据的展示方式,帮助用户清晰了解消费结构,便于调整开支习惯。
说起支出分析,我自己是记了一段时间账之后才意识到它的重要性。光记账不分析,就像收集了一堆数据却不知道怎么用。后来加上了图表分析功能,才发现原来自己的钱都花在了这些地方。
为什么需要支出分析
记账的目的不是为了记录,而是为了分析和改进。支出分析能让你看清楚钱都花哪儿去了,哪些是必要支出,哪些是可以节省的。我在设计这个功能的时候,想法很明确:
- 直观展示:用图表展示,比数字更直观
- 多维分析:按分类、按时间、按金额分析
- 趋势对比:看出消费趋势,及时调整
- 重点突出:突出显示占比最大的支出
页面布局设计
支出分析页面分为三部分:总支出概览、饼图分布、分类详情。先看看基本结构:
class ExpenseAnalysisPage extends StatelessWidget {
const ExpenseAnalysisPage({super.key});
Widget build(BuildContext context) {
return Scaffold(
appBar: AppBar(
title: const Text('支出分析'),
),
body: SingleChildScrollView(
padding: EdgeInsets.all(16.w),
child: Column(
crossAxisAlignment: CrossAxisAlignment.start,
children: [
_buildTotalExpense(),
SizedBox(height: 24.h),
_buildPieChart(),
SizedBox(height: 24.h),
_buildCategoryList(),
],
),
),
);
}
}
用SingleChildScrollView包裹,确保内容多的时候可以滚动。三个部分依次排列,层次清晰。
总支出卡片
Widget _buildTotalExpense() {
  return Container(
    padding: EdgeInsets.all(20.w),
    decoration: BoxDecoration(
      gradient: const LinearGradient(
        colors: [Colors.red, Colors.deepOrange],
      ),
      borderRadius: BorderRadius.circular(16.r),
    ),
    child: Column(
      crossAxisAlignment: CrossAxisAlignment.start,
      children: [
        Text(
          '本月总支出',
          style: TextStyle(color: Colors.white70, fontSize: 14.sp),
        ),
        SizedBox(height: 8.h),
        Text(
          '¥ 3,240.50',
          style: TextStyle(
            color: Colors.white,
            fontSize: 36.sp,
            fontWeight: FontWeight.bold,
          ),
        ),
        SizedBox(height: 8.h),
        Text(
          '较上月减少 12%',
          style: TextStyle(color: Colors.white70, fontSize: 14.sp),
        ),
      ],
    ),
  );
}
总支出用红色渐变卡片,红色代表支出,视觉上很直观。金额用36号大字体,特别醒目。下面显示环比变化,让用户知道消费趋势。
饼图实现
饼图能直观展示各分类的占比:
Widget _buildPieChart() {
  return Container(
    padding: EdgeInsets.all(16.w),
    decoration: BoxDecoration(
      color: Colors.white,
      borderRadius: BorderRadius.circular(12.r),
    ),
    child: Column(
      crossAxisAlignment: CrossAxisAlignment.start,
      children: [
        Text(
          '支出分布',
          style: TextStyle(fontSize: 16.sp, fontWeight: FontWeight.bold),
        ),
        SizedBox(height: 20.h),
        SizedBox(
          height: 200.h,
          child: PieChart(
            PieChartData(
              sectionsSpace: 2,
              centerSpaceRadius: 40.r,
              sections: [
                PieChartSectionData(
                  value: 35,
                  title: '35%',
                  color: Colors.orange,
                  radius: 50.r,
                ),
                PieChartSectionData(
                  value: 25,
                  title: '25%',
                  color: Colors.blue,
                  radius: 50.r,
                ),
                PieChartSectionData(
                  value: 20,
                  title: '20%',
                  color: Colors.purple,
                  radius: 50.r,
                ),
                PieChartSectionData(
                  value: 20,
                  title: '20%',
                  color: Colors.pink,
                  radius: 50.r,
                ),
              ],
            ),
          ),
        ),
      ],
    ),
  );
}
用fl_chart包的PieChart组件实现饼图。中间留空40的半径,形成环形图,看起来更现代。每个扇区显示百分比,颜色和分类对应。
分类详情列表
Widget _buildCategoryList() {
  final categories = [
    {'name': '餐饮', 'amount': 1134.0, 'percent': 35, 'color': Colors.orange},
    {'name': '交通', 'amount': 810.0, 'percent': 25, 'color': Colors.blue},
    {'name': '购物', 'amount': 648.0, 'percent': 20, 'color': Colors.purple},
    {'name': '娱乐', 'amount': 648.0, 'percent': 20, 'color': Colors.pink},
  ];

  return Column(
    crossAxisAlignment: CrossAxisAlignment.start,
    children: [
      Text(
        '分类详情',
        style: TextStyle(fontSize: 16.sp, fontWeight: FontWeight.bold),
      ),
      SizedBox(height: 12.h),
      ...categories.map((category) => _buildCategoryItem(category)),
    ],
  );
}
饼图下方列出详细数据,图表和数据结合,信息更完整。
分类项设计
Widget _buildCategoryItem(Map<String, dynamic> category) {
  return Container(
    margin: EdgeInsets.only(bottom: 12.h),
    padding: EdgeInsets.all(16.w),
    decoration: BoxDecoration(
      color: Colors.white,
      borderRadius: BorderRadius.circular(12.r),
    ),
    child: Row(
      children: [
        Container(
          width: 4.w,
          height: 40.h,
          decoration: BoxDecoration(
            color: category['color'] as Color,
            borderRadius: BorderRadius.circular(2.r),
          ),
        ),
        SizedBox(width: 12.w),
        Expanded(
          child: Column(
            crossAxisAlignment: CrossAxisAlignment.start,
            children: [
              Text(
                category['name'] as String,
                style: TextStyle(fontSize: 14.sp, fontWeight: FontWeight.bold),
              ),
              SizedBox(height: 4.h),
              Text(
                '${category['percent']}%',
                style: TextStyle(fontSize: 12.sp, color: Colors.grey),
              ),
            ],
          ),
        ),
        Text(
          '¥${category['amount']}',
          style: TextStyle(fontSize: 16.sp, fontWeight: FontWeight.bold),
        ),
      ],
    ),
  );
}
左边用彩色竖条标识分类,颜色和饼图对应。中间显示分类名称和占比,右边显示金额。
时间筛选功能
可以按不同时间段查看支出:
class TimeFilter extends StatefulWidget {
final Function(DateTime start, DateTime end) onFilterChanged;
const TimeFilter({super.key, required this.onFilterChanged});
State<TimeFilter> createState() => _TimeFilterState();
}
class _TimeFilterState extends State<TimeFilter> {
String selectedPeriod = '本月';
final periods = ['本周', '本月', '本季度', '本年', '自定义'];
Widget build(BuildContext context) {
return SingleChildScrollView(
scrollDirection: Axis.horizontal,
child: Row(
children: periods.map((period) {
final isSelected = period == selectedPeriod;
return Padding(
padding: EdgeInsets.only(right: 8.w),
child: ChoiceChip(
label: Text(period),
selected: isSelected,
onSelected: (selected) {
if (selected) {
setState(() => selectedPeriod = period);
_applyFilter(period);
}
},
),
);
}).toList(),
),
);
}
void _applyFilter(String period) {
final now = DateTime.now();
DateTime start, end;
switch (period) {
case '本周':
start = now.subtract(Duration(days: now.weekday - 1));
end = now;
break;
case '本月':
start = DateTime(now.year, now.month, 1);
end = now;
break;
case '本季度':
final quarter = (now.month - 1) ~/ 3;
start = DateTime(now.year, quarter * 3 + 1, 1);
end = now;
break;
case '本年':
start = DateTime(now.year, 1, 1);
end = now;
break;
default:
return;
}
widget.onFilterChanged(start, end);
}
}
用ChoiceChip实现时间筛选,横向滚动,不占太多空间。选中后自动计算时间范围,更新数据。
趋势图表
除了饼图,还可以用折线图展示趋势:
Widget buildTrendChart(List<Map<String, dynamic>> dailyExpenses) {
  return Container(
    padding: EdgeInsets.all(16.w),
    decoration: BoxDecoration(
      color: Colors.white,
      borderRadius: BorderRadius.circular(12.r),
    ),
    child: Column(
      crossAxisAlignment: CrossAxisAlignment.start,
      children: [
        Text(
          '支出趋势',
          style: TextStyle(fontSize: 16.sp, fontWeight: FontWeight.bold),
        ),
        SizedBox(height: 20.h),
        SizedBox(
          height: 200.h,
          child: LineChart(
            LineChartData(
              gridData: const FlGridData(show: true),
              titlesData: FlTitlesData(
                bottomTitles: AxisTitles(
                  sideTitles: SideTitles(
                    showTitles: true,
                    getTitlesWidget: (value, meta) {
                      return Text('${value.toInt()}日', style: TextStyle(fontSize: 10.sp));
                    },
                  ),
                ),
                leftTitles: const AxisTitles(sideTitles: SideTitles(showTitles: false)),
                topTitles: const AxisTitles(sideTitles: SideTitles(showTitles: false)),
                rightTitles: const AxisTitles(sideTitles: SideTitles(showTitles: false)),
              ),
              borderData: FlBorderData(show: false),
              lineBarsData: [
                LineChartBarData(
                  spots: dailyExpenses.asMap().entries.map((entry) {
                    return FlSpot(entry.key.toDouble(), entry.value['amount'] as double);
                  }).toList(),
                  isCurved: true,
                  color: Colors.red,
                  barWidth: 3,
                  dotData: const FlDotData(show: true),
                ),
              ],
            ),
          ),
        ),
      ],
    ),
  );
}
折线图能看出每天的支出变化,发现异常支出更容易。
数据计算
分析功能需要对数据进行各种计算:
class ExpenseAnalyzer {
  static Map<String, double> calculateCategoryExpenses(
    List<Map<String, dynamic>> transactions,
    DateTime start,
    DateTime end,
  ) {
    final expenses = <String, double>{};

    for (final transaction in transactions) {
      if (transaction['type'] != 'expense') continue;

      final date = DateTime.parse(transaction['date']);
      if (date.isBefore(start) || date.isAfter(end)) continue;

      final category = transaction['category'] as String;
      final amount = transaction['amount'] as double;
      expenses[category] = (expenses[category] ?? 0) + amount;
    }

    return expenses;
  }

  static double calculateTotal(Map<String, double> expenses) {
    return expenses.values.fold(0, (sum, amount) => sum + amount);
  }

  static Map<String, double> calculatePercentages(Map<String, double> expenses) {
    final total = calculateTotal(expenses);
    if (total == 0) return {};

    return expenses.map((category, amount) =>
      MapEntry(category, (amount / total) * 100)
    );
  }

  static double calculateMonthOverMonth(
    List<Map<String, dynamic>> transactions,
    DateTime currentMonth,
  ) {
    final currentExpenses = calculateMonthExpenses(transactions, currentMonth);
    final lastMonth = DateTime(currentMonth.year, currentMonth.month - 1);
    final lastExpenses = calculateMonthExpenses(transactions, lastMonth);

    if (lastExpenses == 0) return 0;
    return ((currentExpenses - lastExpenses) / lastExpenses) * 100;
  }

  static double calculateMonthExpenses(
    List<Map<String, dynamic>> transactions,
    DateTime month,
  ) {
    final start = DateTime(month.year, month.month, 1);
    final end = DateTime(month.year, month.month + 1, 0);
    final expenses = calculateCategoryExpenses(transactions, start, end);
    return calculateTotal(expenses);
  }
}
这些计算函数是分析功能的核心,要保证计算准确,性能也要好。
排行榜功能
显示支出最多的分类或商家:
Widget buildTopExpenses(List<Map<String, dynamic>> transactions) {
  final categoryExpenses = ExpenseAnalyzer.calculateCategoryExpenses(
    transactions,
    DateTime.now().subtract(const Duration(days: 30)),
    DateTime.now(),
  );

  final sorted = categoryExpenses.entries.toList()
    ..sort((a, b) => b.value.compareTo(a.value));

  return Column(
    crossAxisAlignment: CrossAxisAlignment.start,
    children: [
      Text('支出排行', style: TextStyle(fontSize: 16.sp, fontWeight: FontWeight.bold)),
      SizedBox(height: 12.h),
      ...sorted.take(5).toList().asMap().entries.map((entry) {
        final rank = entry.key + 1;
        final category = entry.value.key;
        final amount = entry.value.value;

        return ListTile(
          leading: CircleAvatar(
            backgroundColor: rank <= 3 ? Colors.orange : Colors.grey,
            child: Text('$rank', style: const TextStyle(color: Colors.white)),
          ),
          title: Text(category),
          trailing: Text(
            '¥${amount.toStringAsFixed(0)}',
            style: TextStyle(fontSize: 16.sp, fontWeight: FontWeight.bold),
          ),
        );
      }),
    ],
  );
}
排行榜能快速看出哪些分类花钱最多,前三名用橙色标识,更醒目。
实际使用体验
我自己用这个支出分析功能已经有一段时间了,感觉还是挺有用的。特别是饼图展示,一眼就能看出哪个分类占比最大。
有时候看到餐饮支出占了35%,就会想想是不是外卖点太多了,下个月要控制一下。数据可视化真的能让人更有感觉,比看数字有用多了。
不过也发现了一些可以改进的地方:
- 对比分析:可以对比不同月份的支出变化
- 预测功能:根据历史数据预测未来支出
- 异常检测:自动发现异常支出,提醒用户
- 导出报告:可以导出PDF或图片格式的分析报告
总结
支出分析是记账App的核心功能之一,让数据变得有意义。一个好的分析功能,能帮助用户更好地了解自己的消费习惯,从而做出改进。
我在开发这个功能的时候,一直在思考怎么让它更直观。后来发现,好的分析功能不是数据最多的,而是最容易理解的。
如果你也在开发类似的功能,建议多从用户角度思考,多试用,多改进。一个好用的支出分析功能,真的能帮助人们更好地管理财务。
欢迎加入开源鸿蒙跨平台社区:https://openharmonycrossplatform.csdn.net

开源鸿蒙跨平台开发社区汇聚开发者与厂商,共建“一次开发,多端部署”的开源生态,致力于降低跨端开发门槛,推动万物智联创新。
更多推荐
 3
3 0
0- 0


 已为社区贡献30条内容

所有评论(0)