标签分类助手 - Flutter OpenHarmony财务工具
·
更新概述
v1.22.0 版本为 OpenHarmony 钱包应用增加了标签统计分析功能。用户现在可以查看标签的使用统计,包括标签的使用次数、总金额、占比等信息。这个新功能帮助用户深入了解交易标签的使用情况,优化标签管理策略。

核心功能更新
1. 标签统计数据模型
TagStatData 类定义
/// 标签统计数据模型
class TagStatData {
  final String tag;
  final int count;
  final double amount;
  final Color color;

  TagStatData({
    required this.tag,
    required this.count,
    required this.amount,
    required this.color,
  });

  /// 获取百分比
  double getPercentage(double total) {
    return total > 0 ? (amount / total * 100) : 0;
  }
}
说明:
- 记录标签名称、使用次数、总金额
- 记录该标签的颜色
- 提供百分比计算方法
2. 标签统计服务
TagStatService 类
/// 标签统计服务
class TagStatService {
  /// 获取标签统计
  static List<TagStatData> getTagStats(
    List<wallet.Transaction> transactions,
    DateTime startDate,
    DateTime endDate,
  ) {
    Map<String, int> countMap = {};
    Map<String, double> amountMap = {};

    final filtered = transactions.where((t) {
      return t.date.isAfter(startDate) &&
          t.date.isBefore(endDate.add(const Duration(days: 1)));
    }).toList();

    for (var transaction in filtered) {
      for (var tag in transaction.tags) {
        countMap[tag] = (countMap[tag] ?? 0) + 1;
        amountMap[tag] = (amountMap[tag] ?? 0) + transaction.amount;
      }
    }

    final colors = [
      Colors.blue,
      Colors.purple,
      Colors.pink,
      Colors.red,
      Colors.orange,
      Colors.amber,
      Colors.green,
      Colors.teal,
      Colors.cyan,
      Colors.indigo,
    ];

    int colorIndex = 0;
    return countMap.entries.map((entry) {
      final color = colors[colorIndex % colors.length];
      colorIndex++;
      return TagStatData(
        tag: entry.key,
        count: entry.value,
        amount: amountMap[entry.key] ?? 0,
        color: color,
      );
    }).toList()
      ..sort((a, b) => b.count.compareTo(a.count));
  }
}
说明:
getTagStats: 获取标签统计- 自动分配颜色
- 按使用次数排序
标签统计颜色
| 颜色 | 说明 |
|---|---|
| 蓝色 | 第一标签 |
| 紫色 | 第二标签 |
| 粉色 | 第三标签 |
| 红色 | 第四标签 |
| 橙色 | 第五标签 |
3. 标签统计获取方法
钱包组件中的统计方法
/// 获取标签统计
Map<String, int> getTagStats() {
  Map<String, int> stats = {};
  for (var transaction in _transactions) {
    for (var tag in transaction.tags) {
      stats[tag] = (stats[tag] ?? 0) + 1;
    }
  }
  return stats;
}

/// 获取标签金额统计
Map<String, double> getTagAmountStats() {
  Map<String, double> stats = {};
  for (var transaction in _transactions) {
    for (var tag in transaction.tags) {
      stats[tag] = (stats[tag] ?? 0) + transaction.amount;
    }
  }
  return stats;
}
说明:
getTagStats: 获取标签使用次数getTagAmountStats: 获取标签总金额- 支持多标签统计

4. 标签统计显示
标签统计卡片
/// 构建标签统计卡片
Widget _buildTagStatCard(TagStatData stat, double total) {
  return Padding(
    padding: const EdgeInsets.symmetric(vertical: 8),
    child: Column(
      crossAxisAlignment: CrossAxisAlignment.start,
      children: [
        Row(
          mainAxisAlignment: MainAxisAlignment.spaceBetween,
          children: [
            Row(
              children: [
                Container(
                  width: 12,
                  height: 12,
                  decoration: BoxDecoration(
                    color: stat.color,
                    borderRadius: BorderRadius.circular(2),
                  ),
                ),
                const SizedBox(width: 8),
                Text(stat.tag, style: const TextStyle(fontWeight: FontWeight.w600)),
              ],
            ),
            Text('${stat.count} 笔', style: const TextStyle(fontSize: 12, color: Colors.grey)),
          ],
        ),
        const SizedBox(height: 6),
        Row(
          children: [
            Expanded(
              child: LinearProgressIndicator(
                value: stat.getPercentage(total) / 100,
                minHeight: 6,
                backgroundColor: Colors.grey.shade300,
                valueColor: AlwaysStoppedAnimation<Color>(stat.color),
              ),
            ),
            const SizedBox(width: 12),
            Text('¥${stat.amount.toStringAsFixed(2)}', style: const TextStyle(fontWeight: FontWeight.bold)),
          ],
        ),
      ],
    ),
  );
}
说明:
- 显示标签名称和使用次数
- 进度条显示金额占比
- 显示标签总金额
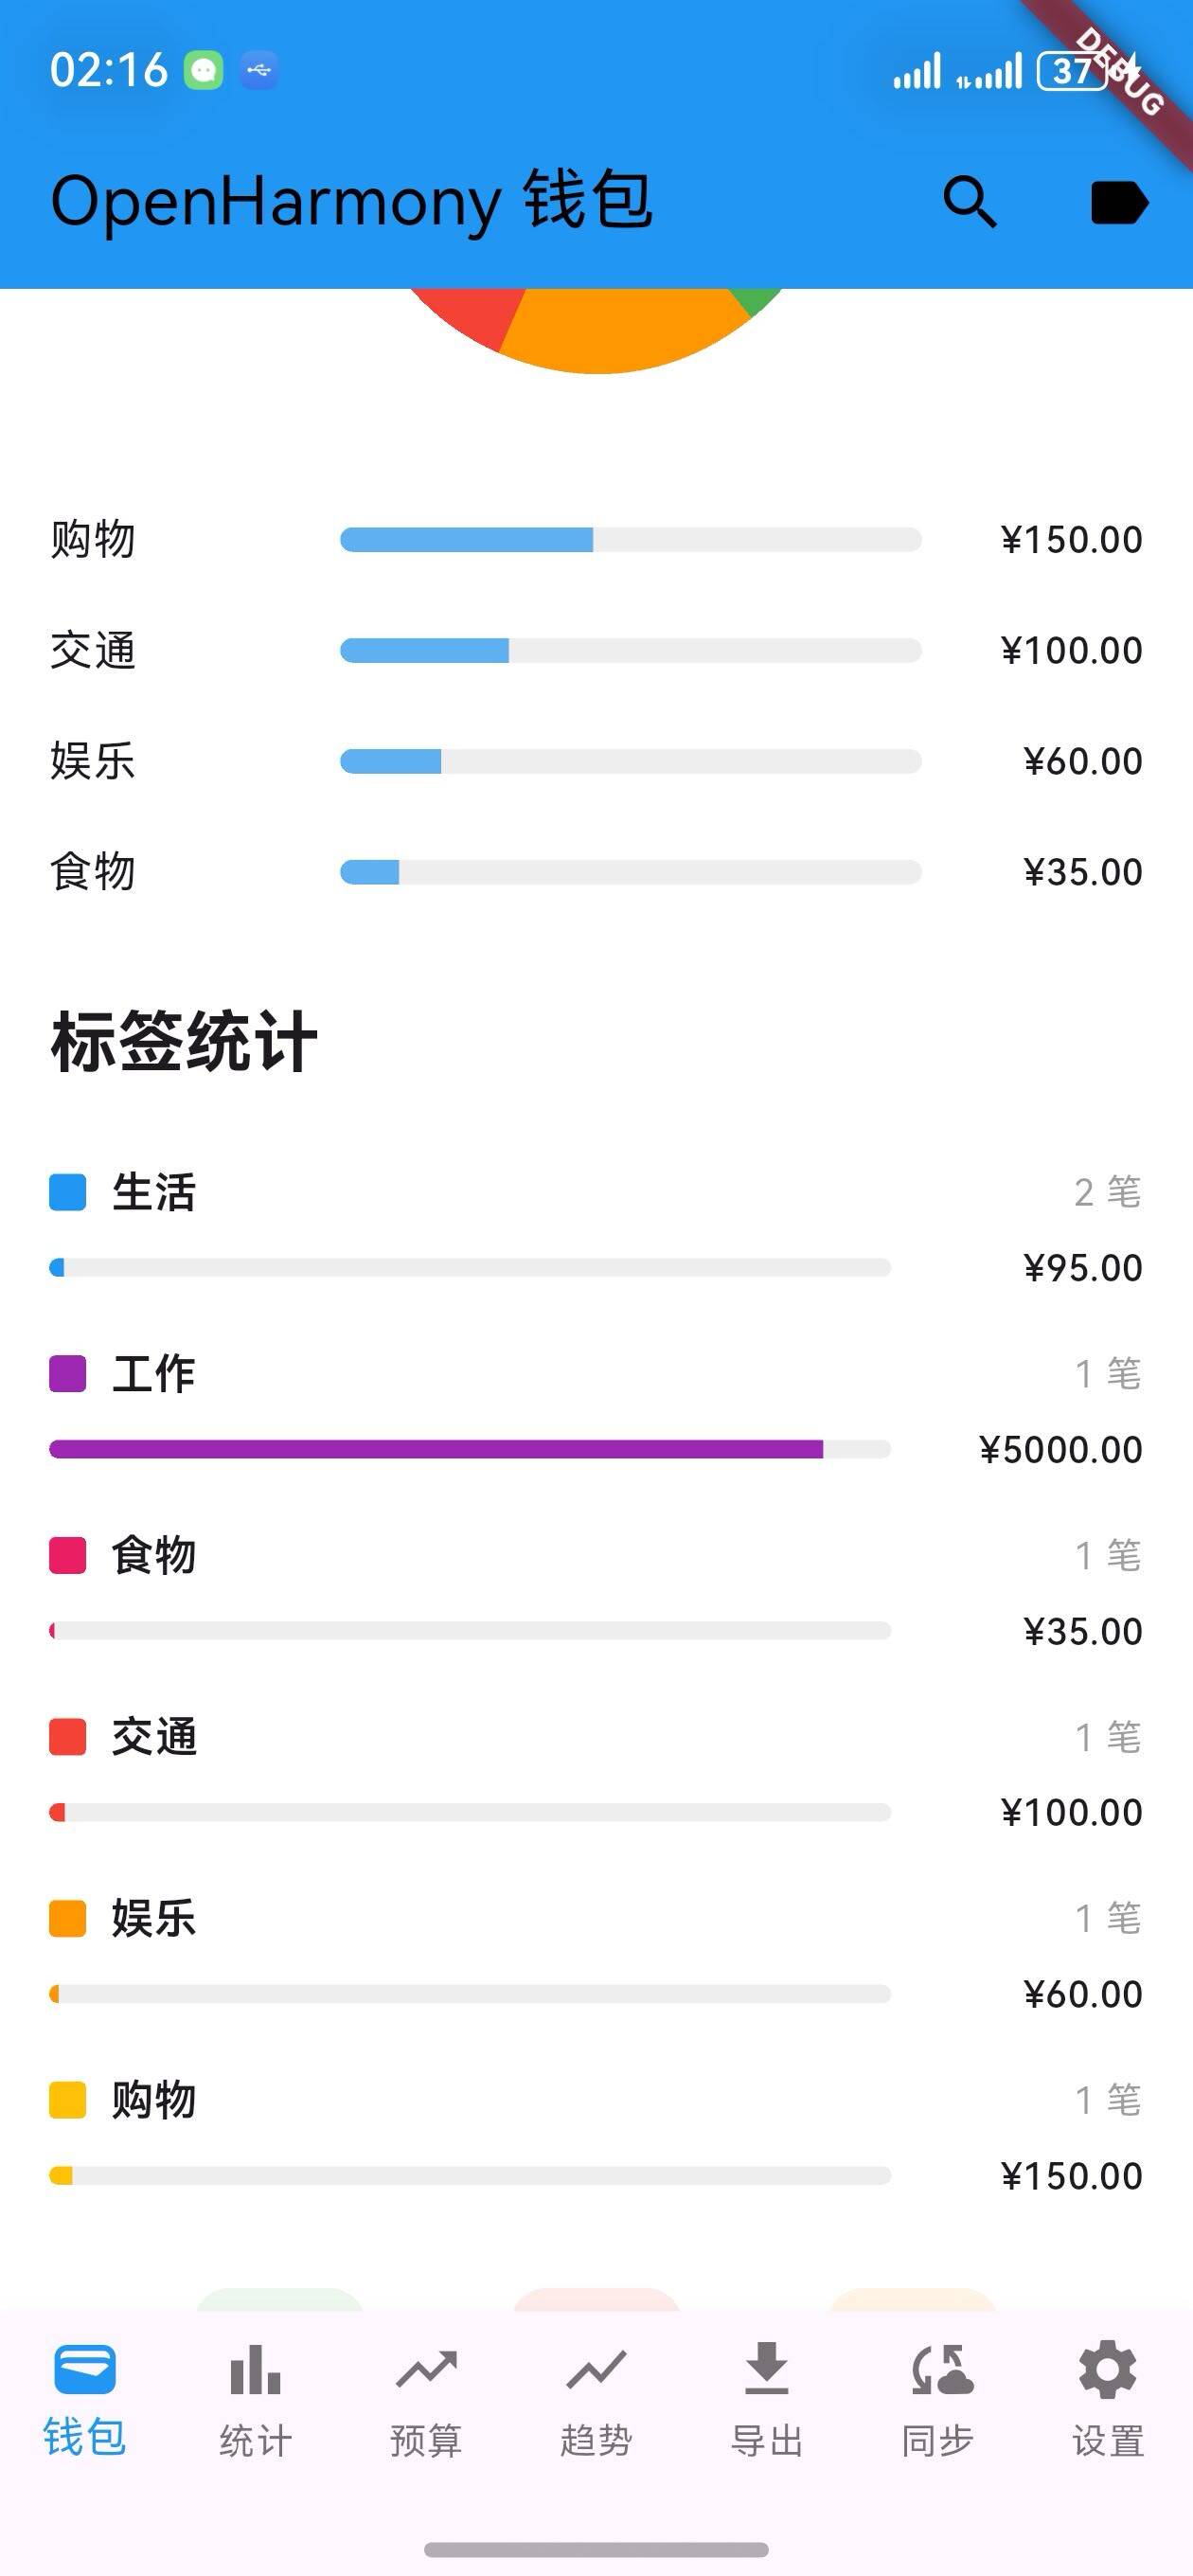
UI 变化
标签统计页面布局
┌─────────────────────────────────┐
│  标签统计                        │
├─────────────────────────────────┤
│  标签统计                        │
│                                 │
│  🔵 工作                  5 笔   │
│  [████████░░░░░░░░░░] ¥2500    │
│                                 │
│  🟣 生活                  4 笔   │
│  [██████░░░░░░░░░░░░░░] ¥1800  │
│                                 │
│  🟡 娱乐                  3 笔   │
│  [████░░░░░░░░░░░░░░░░░░] ¥900 │
│                                 │
│  🔴 购物                  2 笔   │
│  [██░░░░░░░░░░░░░░░░░░░░░░] ¥400│
│                                 │
│  🟠 交通                  1 笔   │
│  [░░░░░░░░░░░░░░░░░░░░░░░░░░] ¥100│
└─────────────────────────────────┘
版本对比
| 功能 | v1.21.0 | v1.22.0 |
|---|---|---|
| 交易收藏 | ✅ | ✅ |
| 收藏标记 | ✅ | ✅ |
| 标签统计模型 | ❌ | ✅ |
| 标签统计服务 | ❌ | ✅ |
| 标签使用统计 | ❌ | ✅ |
| 标签金额统计 | ❌ | ✅ |
| 标签进度条 | ❌ | ✅ |
| 标签排序 | ❌ | ✅ |
使用场景
场景 1:查看标签使用统计
- 进入钱包页面
- 查看标签统计信息
- 了解各标签的使用频率
- 优化标签使用
场景 2:查看标签金额分布
- 进入标签统计页面
- 查看各标签的总金额
- 了解标签的金额占比
- 分析消费结构
场景 3:对比标签使用情况
- 进入标签统计页面
- 查看多个标签的统计
- 对比使用频率和金额
- 调整标签策略
场景 4:评估标签有效性
- 查看标签统计数据
- 识别使用频率低的标签
- 评估标签的有效性
- 优化标签体系
技术亮点
1. 灵活的标签统计
- 支持多维度统计
- 自动分配颜色
- 按频率排序
2. 直观的进度条展示
- 百分比一目了然
- 颜色编码便于识别
- 支持多标签展示
3. 完整的数据展示
- 显示使用次数
- 显示总金额
- 显示占比百分比
4. 简洁的交互设计
- 清晰的统计信息
- 易于理解的布局
- 快速查看统计
欢迎加入开源鸿蒙跨平台社区:https://openharmonycrossplatform.csdn.net

开源鸿蒙跨平台开发社区汇聚开发者与厂商,共建“一次开发,多端部署”的开源生态,致力于降低跨端开发门槛,推动万物智联创新。
更多推荐
 5
5 0
0- 0


 已为社区贡献15条内容

所有评论(0)