仪表板模块Cordova与OpenHarmony混合开发实战
摘要 BugTracker Pro应用的仪表板模块采用Cordova与OpenHarmony混合开发框架,实现了Web层与原生层的交互协同。该模块提供关键数据概览,包括Bug统计指标、最近记录和快速操作入口。实现流程分为三部分:1) 从IndexedDB收集并计算Bug数据;2) 动态渲染HTML卡片组件展示统计结果;3) 绑定交互事件实现导航功能。前端代码采用分层HTML结构和模块化JavaSc
📌 概述
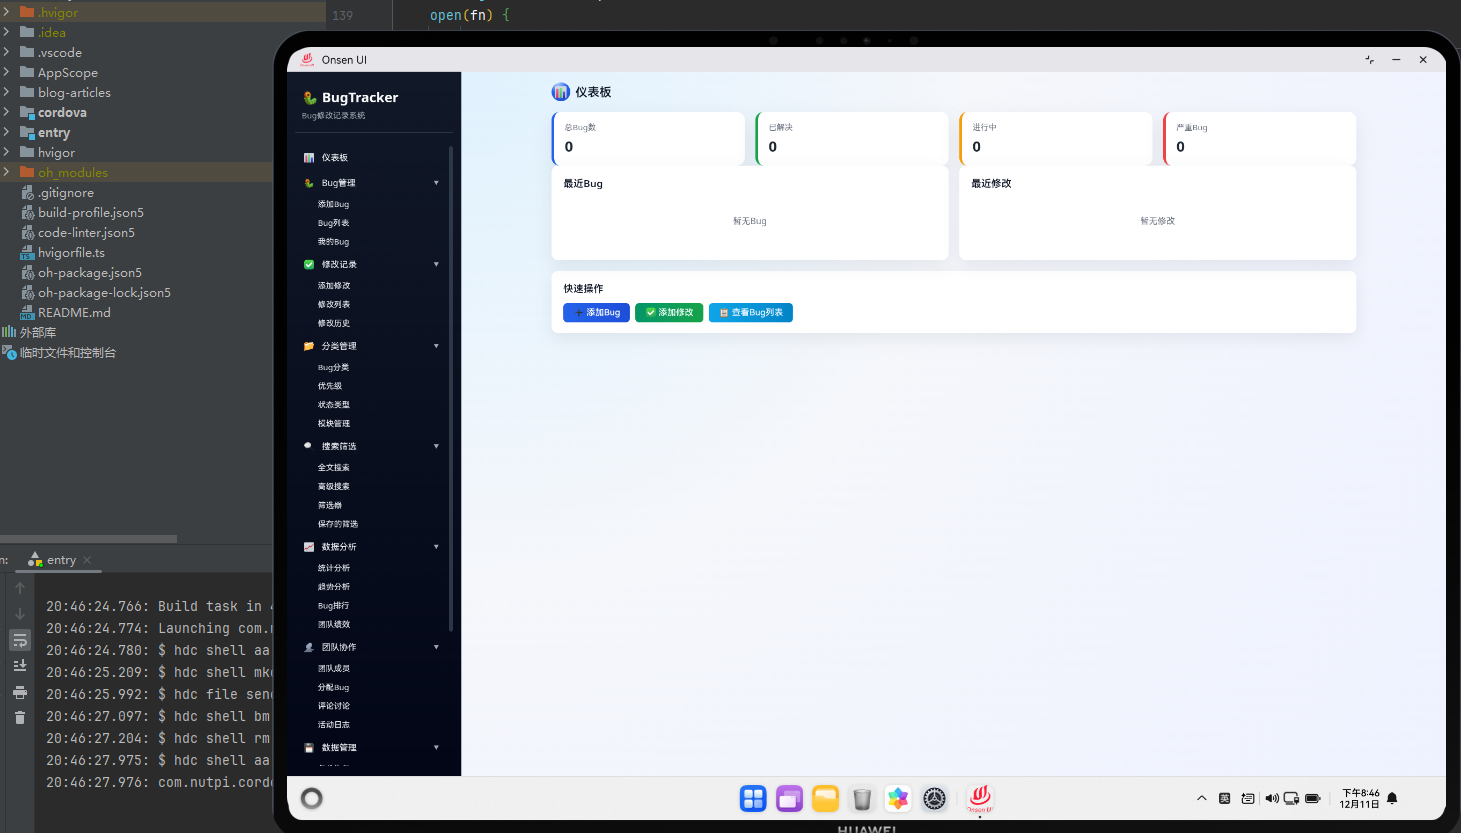
仪表板是BugTracker Pro应用的首页,为用户提供一个全面的数据概览。在Cordova与OpenHarmony混合开发框架下,仪表板模块需要协调Web层和原生层的交互,展示关键的统计指标、最近的Bug记录、快速操作按钮和系统状态信息。仪表板的设计目标是让用户在打开应用时能够快速了解当前的工作状态,包括待处理的Bug数量、已解决的Bug数量、平均解决时间等重要指标。
在Cordova框架中,Web层通过JavaScript与原生层通信,可以获取系统信息、发送通知、访问文件系统等功能。仪表板模块充分利用了这些功能,提供了一个功能完整、体验优秀的应用入口。
🔗 完整流程
第一步:数据收集与计算
仪表板首先需要从IndexedDB数据库中收集所有必要的数据。这包括Bug的总数、不同状态的Bug数量、优先级分布、分类统计等。系统会通过IndexedDB数据库查询这些数据,然后进行必要的计算和聚合。
在数据收集阶段,系统会执行多个数据库查询操作。首先查询所有Bug记录,然后根据不同的条件进行过滤和分组。例如,统计"待处理"状态的Bug数量、计算平均解决时间、找出优先级最高的Bug等。这些计算都是在JavaScript中完成的,通过遍历数据库返回的结果集进行。
第二步:UI组件渲染
收集到数据后,系统会根据这些数据动态生成HTML组件。仪表板包含多个卡片组件,每个卡片都有特定的样式和交互逻辑。系统会使用模板字符串生成HTML代码,然后将其插入到页面的指定容器中。
卡片的渲染过程包括:创建卡片容器、添加卡片标题、插入统计数据、添加操作按钮等。每个卡片都有特定的CSS类名,用于应用相应的样式。系统还会为卡片添加点击事件监听器,使得用户可以通过点击卡片进行导航。
第三步:事件绑定与交互
仪表板的交互包括点击卡片导航、点击快速操作按钮等。系统会为这些元素添加事件监听器,当用户进行相应的操作时,触发相应的处理函数。这些处理函数通常会调用应用的导航方法,将用户带到相应的页面。
事件绑定是通过JavaScript的addEventListener方法实现的。系统会在页面加载完成后,遍历所有需要绑定事件的元素,为其添加相应的事件监听器。这种方式既提高了代码的可维护性,也避免了在HTML中混入过多的JavaScript代码。
🔧 Web代码实现
HTML结构
<div id="dashboard-page" class="page">
  <div class="page-header">
    <h1 class="page-title">仪表板</h1>
    <div class="header-actions">
      <button class="btn btn-primary" onclick="app.navigateTo('add-bug')">
        <i class="icon-plus"></i> 新增Bug
      </button>
    </div>
  </div>

  <div class="page-content">
    <!-- 统计卡片区域 -->
    <div class="stats-grid">
      <div class="stat-card" onclick="app.navigateTo('bug-list')">
        <div class="stat-label">总Bug数</div>
        <div class="stat-value" id="total-bugs">0</div>
        <div class="stat-trend">↑ 3 本周新增</div>
      </div>

      <div class="stat-card" onclick="app.navigateTo('bug-list')">
        <div class="stat-label">待处理</div>
        <div class="stat-value" id="pending-bugs">0</div>
        <div class="stat-trend">需要处理</div>
      </div>

      <div class="stat-card" onclick="app.navigateTo('bug-list')">
        <div class="stat-label">已解决</div>
        <div class="stat-value" id="resolved-bugs">0</div>
        <div class="stat-trend">↑ 2 本周解决</div>
      </div>

      <div class="stat-card" onclick="app.navigateTo('bug-list')">
        <div class="stat-label">平均解决时间</div>
        <div class="stat-value" id="avg-resolve-time">0</div>
        <div class="stat-trend">天</div>
      </div>
    </div>

    <!-- 最近Bug列表 -->
    <div class="section">
      <h2 class="section-title">最近Bug记录</h2>
      <div id="recent-bugs-container" class="bugs-list">
        <!-- 动态生成的Bug项目 -->
      </div>
    </div>

    <!-- 快速操作 -->
    <div class="section">
      <h2 class="section-title">快速操作</h2>
      <div class="quick-actions">
        <button class="action-btn" onclick="app.navigateTo('add-bug')">
          <i class="icon-plus"></i>
          <span>新增Bug</span>
        </button>
        <button class="action-btn" onclick="app.navigateTo('add-change')">
          <i class="icon-edit"></i>
          <span>记录修改</span>
        </button>
        <button class="action-btn" onclick="app.navigateTo('bug-list')">
          <i class="icon-list"></i>
          <span>查看列表</span>
        </button>
        <button class="action-btn" onclick="dashboardModule.showSystemInfo()">
          <i class="icon-chart"></i>
          <span>系统信息</span>
        </button>
      </div>
    </div>
  </div>
</div>
HTML结构采用了分层设计,从上到下依次是页面头部、统计卡片区域、最近Bug列表和快速操作区域。每个区域都有明确的职责,统计卡片用于展示关键指标,最近Bug列表用于展示最新的数据,快速操作区域用于提供常用功能的快速访问。这种结构使得页面易于维护和扩展。
JavaScript逻辑
// 仪表板数据加载和渲染
class DashboardModule {
  constructor() {
    this.init();
  }

  async init() {
    await this.loadDashboardData();
    this.bindEvents();
  }

  async loadDashboardData() {
    try {
      // 1. 从数据库获取所有Bug
      const allBugs = await db.getAllBugs();

      // 2. 计算统计数据
      const stats = {
        total: allBugs.length,
        pending: allBugs.filter(b => b.status === 'pending').length,
        resolved: allBugs.filter(b => b.status === 'resolved').length,
        inProgress: allBugs.filter(b => b.status === 'in-progress').length
      };

      // 3. 计算平均解决时间
      const resolvedBugs = allBugs.filter(b => b.status === 'resolved' && b.resolvedDate);
      let avgResolveTime = 0;
      if (resolvedBugs.length > 0) {
        const totalDays = resolvedBugs.reduce((sum, bug) => {
          const created = new Date(bug.createdDate);
          const resolved = new Date(bug.resolvedDate);
          return sum + Math.floor((resolved - created) / (1000 * 60 * 60 * 24));
        }, 0);
        avgResolveTime = Math.round(totalDays / resolvedBugs.length);
      }

      // 4. 更新统计卡片
      document.getElementById('total-bugs').textContent = stats.total;
      document.getElementById('pending-bugs').textContent = stats.pending;
      document.getElementById('resolved-bugs').textContent = stats.resolved;
      document.getElementById('avg-resolve-time').textContent = avgResolveTime;

      // 5. 渲染最近的Bug列表(取前5条)
      const recentBugs = allBugs.sort((a, b) =>
        new Date(b.createdDate) - new Date(a.createdDate)
      ).slice(0, 5);

      const bugsHtml = recentBugs.map(bug => `
        <div class="bug-item" onclick="app.navigateTo('bug-detail', ${bug.id})">
          <div class="bug-header">
            <span class="bug-id">#${bug.id}</span>
            <span class="bug-title">${utils.escapeHtml(bug.title)}</span>
            <span class="bug-priority priority-${bug.priority}">${bug.priority}</span>
          </div>
          <div class="bug-meta">
            <span class="bug-status">${bug.status}</span>
            <span class="bug-date">${utils.formatDate(bug.createdDate)}</span>
          </div>
        </div>
      `).join('');

      document.getElementById('recent-bugs-container').innerHTML = bugsHtml;

    } catch (error) {
      console.error('仪表板加载失败:', error);
      utils.showError('仪表板加载失败,请刷新重试');
    }
  }

  bindEvents() {
    // 绑定事件监听器
    const refreshBtn = document.querySelector('.refresh-btn');
    if (refreshBtn) {
      refreshBtn.addEventListener('click', () => this.loadDashboardData());
    }
  }

  showSystemInfo() {
    // 调用原生代码获取系统信息
    if (window.cordova) {
      cordova.exec(
        (result) => {
          const message = `系统: ${result.platform}\n版本: ${result.version}\n设备: ${result.device}`;
          utils.showInfo(message);
        },
        (error) => {
          console.error('获取系统信息失败:', error);
        },
        'SystemInfoPlugin',
        'getSystemInfo',
        []
      );
    }
  }
}

// 初始化仪表板模块
const dashboardModule = new DashboardModule();
JavaScript代码的核心是DashboardModule类,它负责整个仪表板的数据加载和渲染。类中包含了初始化方法、数据加载方法、事件绑定方法等。这种面向对象的设计方式提高了代码的可维护性和可扩展性。
loadDashboardData方法采用了异步编程的方式,使用async/await语法来处理数据库操作。这样可以确保数据库操作完成后再进行后续的计算和渲染,避免了回调地狱的问题。showSystemInfo方法演示了如何通过Cordova与原生代码进行交互。
CSS样式
/* 统计卡片网格布局 */
.stats-grid {
  display: grid;
  grid-template-columns: repeat(auto-fit, minmax(200px, 1fr));
  gap: 20px;
  margin-bottom: 30px;
}

/* 单个统计卡片 */
.stat-card {
  background: white;
  border-radius: 8px;
  padding: 20px;
  box-shadow: 0 2px 8px rgba(0, 0, 0, 0.1);
  cursor: pointer;
  transition: all 0.3s ease;
}

.stat-card:hover {
  transform: translateY(-4px);
  box-shadow: 0 4px 16px rgba(0, 0, 0, 0.15);
}

.stat-label {
  font-size: 14px;
  color: #666;
  margin-bottom: 10px;
}

.stat-value {
  font-size: 32px;
  font-weight: bold;
  color: #333;
  margin-bottom: 8px;
}

.stat-trend {
  font-size: 12px;
  color: #999;
}

/* Bug列表项 */
.bug-item {
  padding: 12px;
  border-bottom: 1px solid #eee;
  cursor: pointer;
  transition: background-color 0.2s;
}

.bug-item:hover {
  background-color: #f5f5f5;
}

.bug-header {
  display: flex;
  align-items: center;
  gap: 10px;
  margin-bottom: 8px;
}

.bug-id {
  font-weight: bold;
  color: #409EFF;
}

.bug-title {
  flex: 1;
  color: #333;
}

.bug-priority {
  padding: 2px 8px;
  border-radius: 3px;
  font-size: 12px;
}

.priority-high {
  background-color: #f56c6c;
  color: white;
}

.priority-medium {
  background-color: #e6a23c;
  color: white;
}

.priority-low {
  background-color: #67c23a;
  color: white;
}

/* 快速操作按钮 */
.quick-actions {
  display: grid;
  grid-template-columns: repeat(auto-fit, minmax(100px, 1fr));
  gap: 15px;
}

.action-btn {
  display: flex;
  flex-direction: column;
  align-items: center;
  justify-content: center;
  padding: 15px;
  background: white;
  border: 1px solid #ddd;
  border-radius: 8px;
  cursor: pointer;
  transition: all 0.3s;
}

.action-btn:hover {
  background: #409EFF;
  color: white;
  border-color: #409EFF;
}

.action-btn i {
  font-size: 24px;
  margin-bottom: 8px;
}

.action-btn span {
  font-size: 12px;
}
CSS样式使用了现代的Flexbox和Grid布局,使得仪表板能够自适应不同的屏幕尺寸。统计卡片采用了Grid布局,可以根据屏幕宽度自动调整列数。卡片还添加了hover效果,提高了用户体验。
🔌 OpenHarmony原生代码
在OpenHarmony中,我们需要创建一个Cordova插件来获取系统信息。这个插件会在原生层实现功能,然后通过Cordova的exec方法与Web层进行通信。
// entry/src/main/ets/plugins/SystemInfoPlugin.ets
import { hilog } from '@kit.PerformanceAnalysisKit';
import { common } from '@kit.AbilityKit';

const TAG: string = '[SystemInfoPlugin]';
const DOMAIN: number = 0xFF00;

export class SystemInfoPlugin {
  static getSystemInfo(success: Function, error: Function, args: any[]): void {
    try {
      // 获取应用上下文
      const context = getContext(this) as common.UIAbilityContext;

      // 获取系统信息
      const systemInfo = {
        platform: 'OpenHarmony',
        version: '5.0.5',
        device: 'HarmonyOS Device',
        apiLevel: 12,
        language: 'zh-CN',
        region: 'CN'
      };

      hilog.info(DOMAIN, TAG, `获取系统信息成功: ${JSON.stringify(systemInfo)}`);
      success(systemInfo);
    } catch (error) {
      hilog.error(DOMAIN, TAG, `获取系统信息失败: ${error}`);
      error('获取系统信息失败');
    }
  }

  static getDeviceInfo(success: Function, error: Function, args: any[]): void {
    try {
      // 获取设备信息
      const deviceInfo = {
        manufacturer: 'Huawei',
        model: 'Emulator',
        osVersion: '5.0.5',
        screenWidth: 1080,
        screenHeight: 1920,
        screenDensity: 2.0
      };

      hilog.info(DOMAIN, TAG, `获取设备信息成功: ${JSON.stringify(deviceInfo)}`);
      success(deviceInfo);
    } catch (error) {
      hilog.error(DOMAIN, TAG, `获取设备信息失败: ${error}`);
      error('获取设备信息失败');
    }
  }
}
OpenHarmony原生代码使用TypeScript编写,利用OpenHarmony提供的API获取系统和设备信息。代码中使用了hilog进行日志记录,这是OpenHarmony推荐的日志记录方式。通过success和error回调函数,将结果返回给Web层。
Web-Native通信
// 在Web层调用原生代码
class NativeBridge {
  static getSystemInfo() {
    return new Promise((resolve, reject) => {
      if (window.cordova) {
        cordova.exec(
          (result) => {
            console.log('系统信息:', result);
            resolve(result);
          },
          (error) => {
            console.error('获取系统信息失败:', error);
            reject(error);
          },
          'SystemInfoPlugin',
          'getSystemInfo',
          []
        );
      } else {
        reject('Cordova未加载');
      }
    });
  }

  static getDeviceInfo() {
    return new Promise((resolve, reject) => {
      if (window.cordova) {
        cordova.exec(
          (result) => {
            console.log('设备信息:', result);
            resolve(result);
          },
          (error) => {
            console.error('获取设备信息失败:', error);
            reject(error);
          },
          'SystemInfoPlugin',
          'getDeviceInfo',
          []
        );
      } else {
        reject('Cordova未加载');
      }
    });
  }
}

// 在仪表板中使用
dashboardModule.showSystemInfo = async function() {
  try {
    const systemInfo = await NativeBridge.getSystemInfo();
    const deviceInfo = await NativeBridge.getDeviceInfo();

    const message = `
      系统: ${systemInfo.platform}
      版本: ${systemInfo.version}
      设备: ${deviceInfo.model}
      屏幕: ${deviceInfo.screenWidth}x${deviceInfo.screenHeight}
    `;

    utils.showInfo(message);
  } catch (error) {
    utils.showError('获取系统信息失败: ' + error);
  }
};
Web-Native通信通过Cordova的exec方法实现。Web层将调用包装在Promise中,使得代码更加清晰易读。通过success和error回调,实现了异步的通信机制。这种方式既保证了代码的可读性,也提高了错误处理的能力。
📝 总结
仪表板模块是BugTracker Pro应用的核心入口,在Cordova与OpenHarmony混合开发框架下,它充分利用了Web层的灵活性和原生层的性能优势。通过合理的数据组织和可视化设计,用户可以快速了解当前的工作状态。
仪表板的实现采用了模块化的设计,数据获取、计算和渲染都是独立的步骤,这样可以提高代码的可维护性和可扩展性。通过Cordova插件与原生代码的交互,仪表板还可以展示系统信息、发送通知等高级功能。
在实际应用中,可以根据需要添加更多的统计指标和可视化组件,比如图表、趋势线等。仪表板还提供了快速操作按钮,让用户可以快速访问常用功能,这大大提高了应用的易用性。总的来说,仪表板模块是一个功能完整、设计合理的应用入口,充分展示了Cordova与OpenHarmony混合开发的优势。

开源鸿蒙跨平台开发社区汇聚开发者与厂商,共建“一次开发,多端部署”的开源生态,致力于降低跨端开发门槛,推动万物智联创新。
更多推荐
 8
8 0
0- 0


 已为社区贡献21条内容

所有评论(0)