Flutter for OpenHarmony数独游戏App实战:统计主界面
本文介绍了数独游戏统计页面的设计与实现,重点包括:1) 确定核心统计指标(总游戏数、胜率、连胜记录、各难度平均用时);2) 使用Flutter构建StatelessWidget组件;3) 实现卡片式布局展示关键数据;4) 添加难度分级统计功能。页面采用响应式设计,通过ScreenUtil适配不同设备,并运用阴影、间距等UI元素提升视觉效果。最后展示了如何通过GetBuilder实现数据绑定,将统计
统计页面是数独游戏的重要组成部分。它让玩家可以查看自己的游戏历史、胜率、最佳成绩等数据,这些数据可以激励玩家持续游戏并追求更好的表现。今天我们来详细实现数独游戏的统计主界面。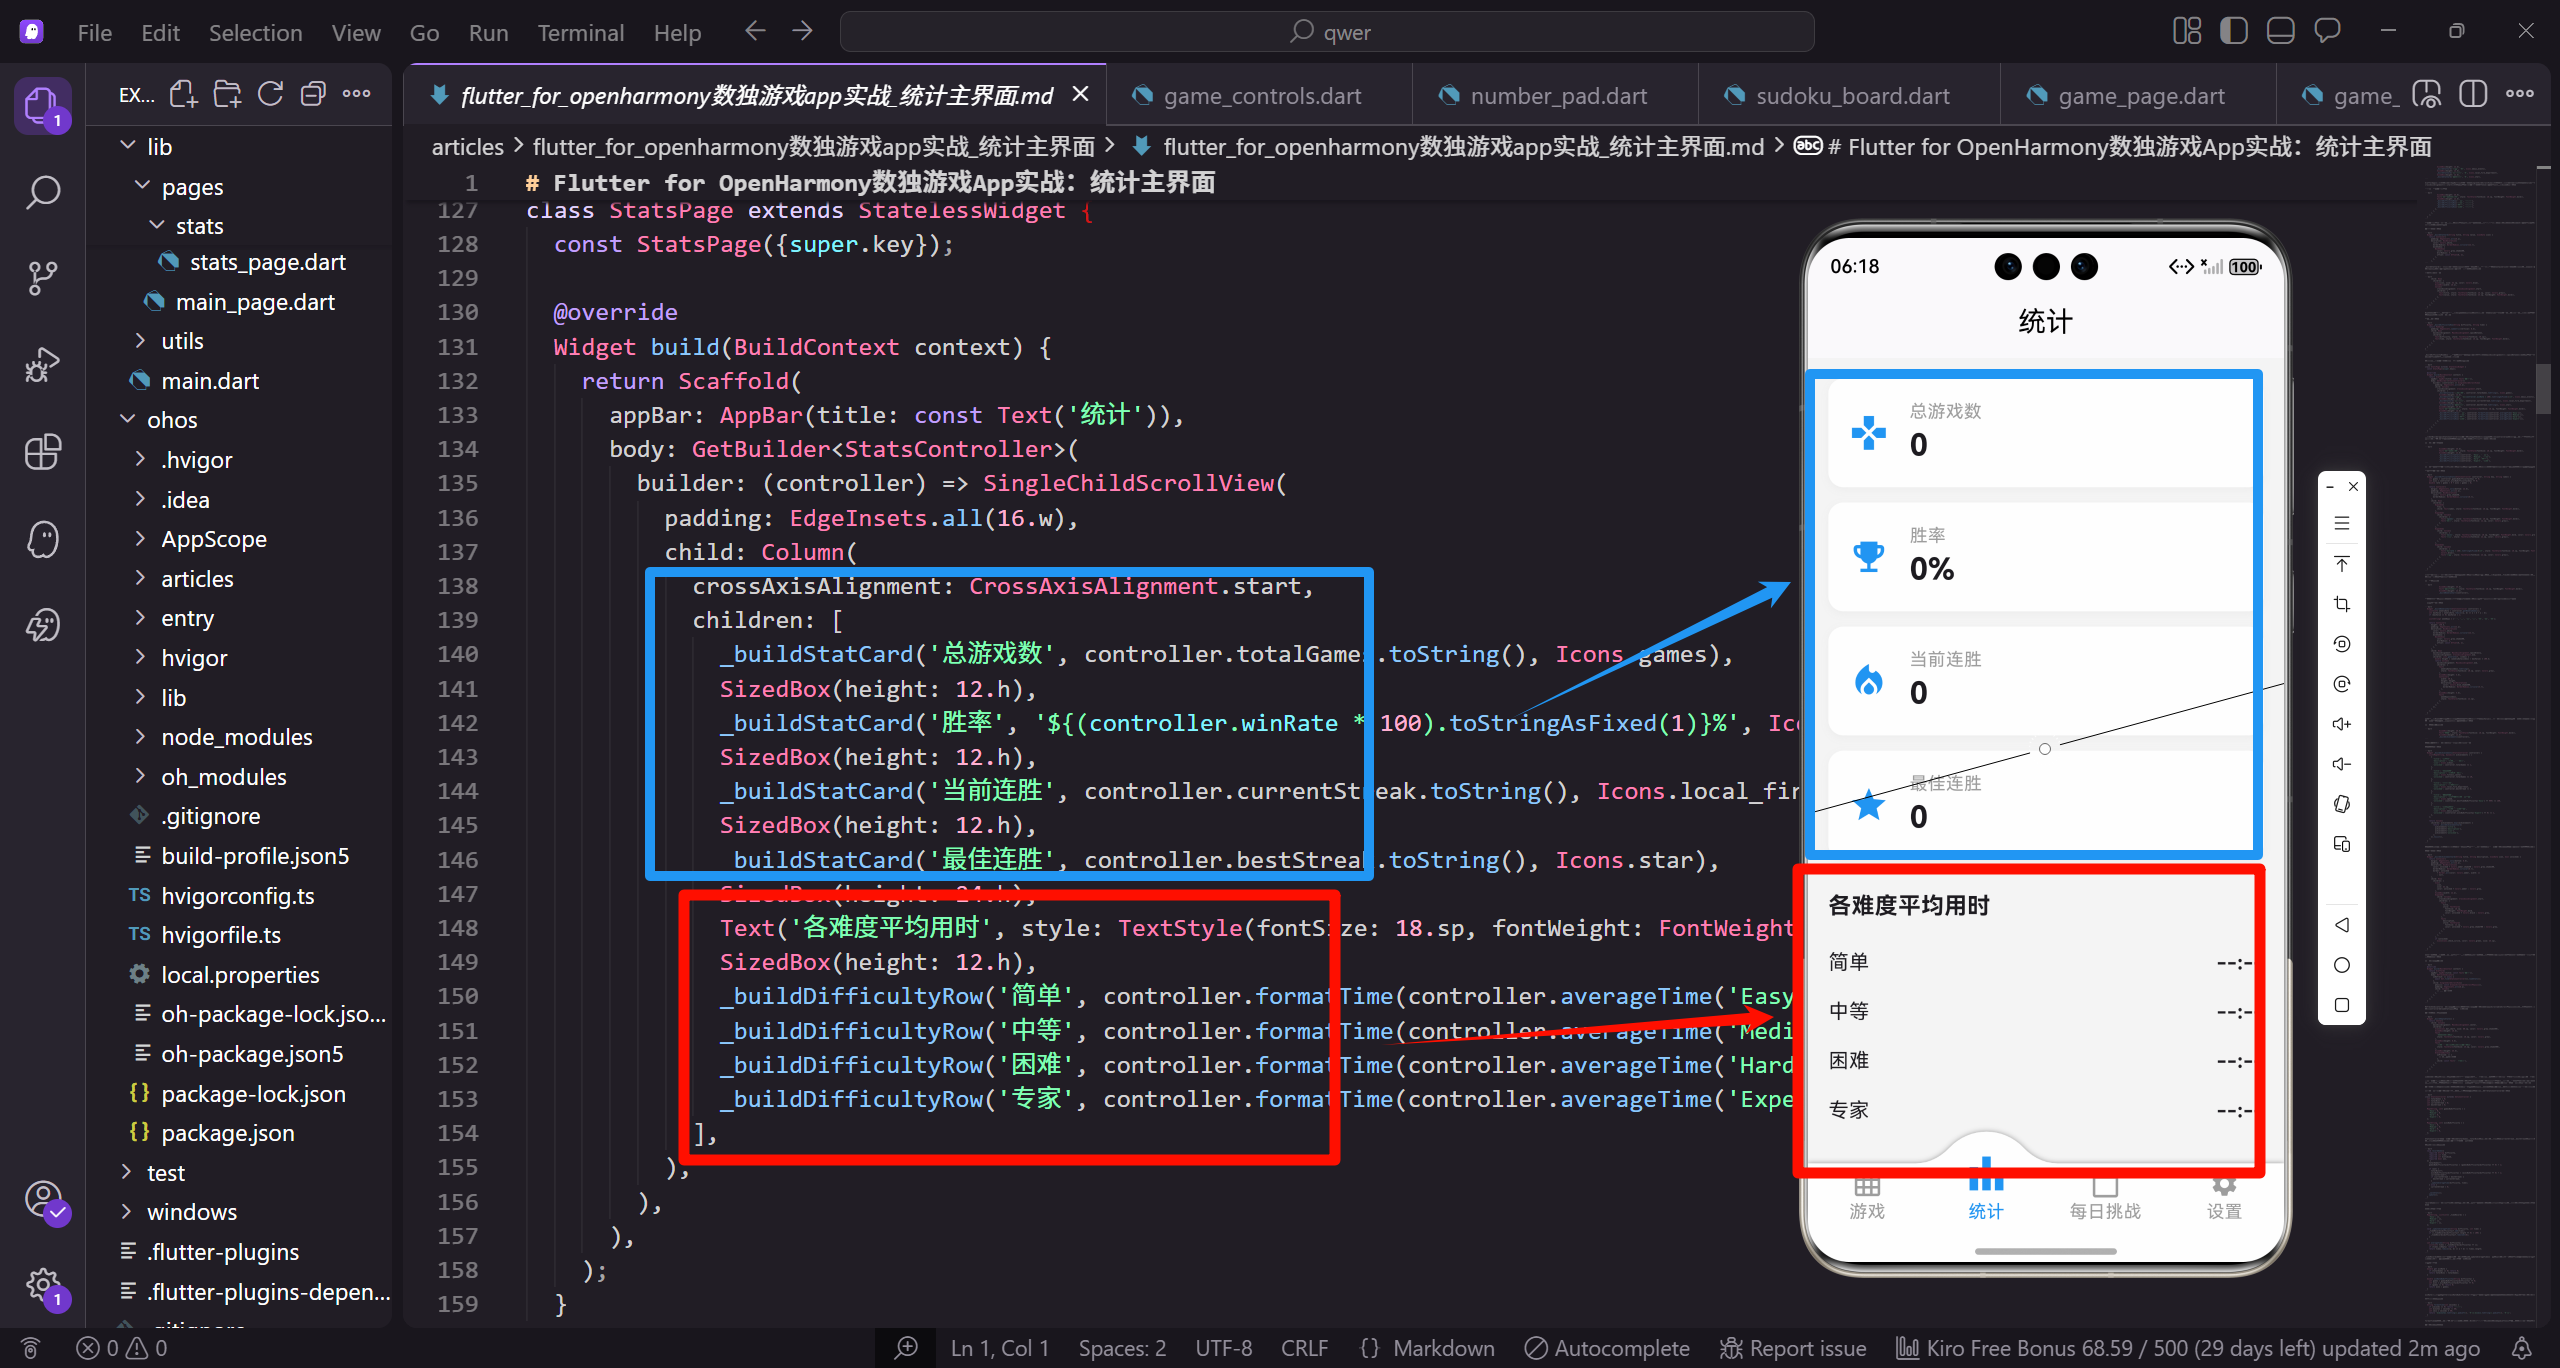
在设计统计页面之前,我们需要确定要展示哪些数据。对于数独游戏,玩家通常关心:总游戏数、胜率、当前连胜、最佳连胜、各难度的平均用时等。这些数据需要以清晰直观的方式呈现,让玩家一眼就能了解自己的游戏表现。
让我们从创建StatsPage组件开始。
import 'package:flutter/material.dart';
import 'package:flutter_screenutil/flutter_screenutil.dart';

class StatsPage extends StatelessWidget {
  const StatsPage({super.key});
StatsPage使用StatelessWidget是因为统计数据通常从外部数据源获取,页面本身不需要管理状态。如果需要实时更新统计数据,可以使用GetBuilder或其他状态管理方案。ScreenUtil用于屏幕适配,确保在不同设备上都有良好的显示效果。
build方法构建页面结构。
Widget build(BuildContext context) {
return Scaffold(
appBar: AppBar(title: const Text('统计')),
body: SingleChildScrollView(
padding: EdgeInsets.all(16.w),
child: Column(
crossAxisAlignment: CrossAxisAlignment.start,
children: [
_buildStatCard('总游戏数', '0', Icons.games),
SizedBox(height: 12.h),
_buildStatCard('胜率', '0%', Icons.emoji_events),
SizedBox(height: 12.h),
_buildStatCard('当前连胜', '0', Icons.local_fire_department),
SizedBox(height: 12.h),
_buildStatCard('最佳连胜', '0', Icons.star),
Scaffold提供基本页面结构,AppBar显示页面标题。SingleChildScrollView让内容可以滚动,适应不同屏幕高度。Column垂直排列各个统计卡片,crossAxisAlignment设为start让内容左对齐。每个统计卡片之间有12像素的间距,使用SizedBox实现。
继续添加难度统计部分。
            SizedBox(height: 24.h),
            Text('各难度平均用时', style: TextStyle(fontSize: 18.sp, fontWeight: FontWeight.bold)),
            SizedBox(height: 12.h),
            _buildDifficultyRow('简单', '--:--'),
            _buildDifficultyRow('中等', '--:--'),
            _buildDifficultyRow('困难', '--:--'),
            _buildDifficultyRow('专家', '--:--'),
          ],
        ),
      ),
    );
  }
难度统计部分有一个标题和四行数据,分别对应四个难度级别。使用"–:–"作为默认值表示还没有数据。24像素的间距将这部分与上面的统计卡片区分开来。这种分组设计让页面结构更清晰。
统计卡片的实现。
  Widget _buildStatCard(String title, String value, IconData icon) {
    return Container(
      padding: EdgeInsets.all(16.w),
      decoration: BoxDecoration(
        color: Colors.white,
        borderRadius: BorderRadius.circular(12.r),
        boxShadow: [
          BoxShadow(
            color: Colors.grey.shade200,
            blurRadius: 4,
            offset: const Offset(0, 2),
          ),
        ],
      ),
_buildStatCard是一个通用的卡片构建方法,接收标题、数值和图标作为参数。Container定义卡片的样式:白色背景、12像素圆角、轻微的阴影效果。阴影使用浅灰色,模糊半径4像素,向下偏移2像素,营造出卡片浮起的效果。
卡片内部的布局。
      child: Row(
        children: [
          Icon(icon, size: 32.sp, color: Colors.blue),
          SizedBox(width: 16.w),
          Column(
            crossAxisAlignment: CrossAxisAlignment.start,
            children: [
              Text(title, style: TextStyle(fontSize: 14.sp, color: Colors.grey)),
              Text(value, style: TextStyle(fontSize: 24.sp, fontWeight: FontWeight.bold)),
            ],
          ),
        ],
      ),
    );
  }
Row水平排列图标和文字。图标使用32sp的大尺寸,蓝色与应用主题一致。Column垂直排列标题和数值,标题使用较小的灰色字体,数值使用较大的粗体字。这种布局让重要信息(数值)更加突出。
难度行的实现。
  Widget _buildDifficultyRow(String difficulty, String time) {
    return Padding(
      padding: EdgeInsets.symmetric(vertical: 8.h),
      child: Row(
        mainAxisAlignment: MainAxisAlignment.spaceBetween,
        children: [
          Text(difficulty, style: TextStyle(fontSize: 16.sp)),
          Text(time, style: TextStyle(fontSize: 16.sp, fontWeight: FontWeight.bold)),
        ],
      ),
    );
  }
}
_buildDifficultyRow构建一行难度数据,难度名称在左,时间在右。mainAxisAlignment设为spaceBetween让两端对齐。垂直方向有8像素的内边距,让各行之间有适当的间距。时间使用粗体突出显示。
现在让我们增强统计页面,添加真实的数据绑定。
class StatsPage extends StatelessWidget {
const StatsPage({super.key});
Widget build(BuildContext context) {
return Scaffold(
appBar: AppBar(title: const Text('统计')),
body: GetBuilder<StatsController>(
builder: (controller) => SingleChildScrollView(
padding: EdgeInsets.all(16.w),
child: Column(
crossAxisAlignment: CrossAxisAlignment.start,
children: [
_buildStatCard('总游戏数', controller.totalGames.toString(), Icons.games),
SizedBox(height: 12.h),
_buildStatCard('胜率', '${(controller.winRate * 100).toStringAsFixed(1)}%', Icons.emoji_events),
SizedBox(height: 12.h),
_buildStatCard('当前连胜', controller.currentStreak.toString(), Icons.local_fire_department),
SizedBox(height: 12.h),
_buildStatCard('最佳连胜', controller.bestStreak.toString(), Icons.star),
SizedBox(height: 24.h),
Text('各难度平均用时', style: TextStyle(fontSize: 18.sp, fontWeight: FontWeight.bold)),
SizedBox(height: 12.h),
_buildDifficultyRow('简单', controller.formatTime(controller.averageTime('Easy'))),
_buildDifficultyRow('中等', controller.formatTime(controller.averageTime('Medium'))),
_buildDifficultyRow('困难', controller.formatTime(controller.averageTime('Hard'))),
_buildDifficultyRow('专家', controller.formatTime(controller.averageTime('Expert'))),
],
),
),
),
);
}
使用GetBuilder绑定StatsController,当统计数据更新时UI会自动刷新。数值从controller获取,胜率转换为百分比并保留一位小数。平均用时通过formatTime方法格式化为"MM:SS"字符串。这种数据绑定让统计页面能够显示真实的游戏数据。
添加更多统计维度。
              SizedBox(height: 24.h),
              Text('各难度游戏数', style: TextStyle(fontSize: 18.sp, fontWeight: FontWeight.bold)),
              SizedBox(height: 12.h),
              _buildDifficultyStats(controller, 'Easy', '简单'),
              _buildDifficultyStats(controller, 'Medium', '中等'),
              _buildDifficultyStats(controller, 'Hard', '困难'),
              _buildDifficultyStats(controller, 'Expert', '专家'),
添加各难度的详细统计,包括游戏数、胜利数、胜率等。这些数据让玩家可以了解自己在不同难度上的表现,找到需要提升的地方。
难度详细统计的实现。
  Widget _buildDifficultyStats(StatsController controller, String key, String label) {
    int games = controller.gamesByDifficulty[key] ?? 0;
    int wins = controller.winsByDifficulty[key] ?? 0;
    double rate = games > 0 ? wins / games : 0;

    return Container(
      margin: EdgeInsets.only(bottom: 12.h),
      padding: EdgeInsets.all(12.w),
      decoration: BoxDecoration(
        color: Colors.grey.shade50,
        borderRadius: BorderRadius.circular(8.r),
      ),
      child: Row(
        children: [
          Expanded(
            flex: 2,
            child: Text(label, style: TextStyle(fontSize: 16.sp, fontWeight: FontWeight.bold)),
          ),
          Expanded(
            child: Column(
              children: [
                Text('$games', style: TextStyle(fontSize: 18.sp, fontWeight: FontWeight.bold)),
                Text('游戏', style: TextStyle(fontSize: 12.sp, color: Colors.grey)),
              ],
            ),
          ),
          Expanded(
            child: Column(
              children: [
                Text('$wins', style: TextStyle(fontSize: 18.sp, fontWeight: FontWeight.bold, color: Colors.green)),
                Text('胜利', style: TextStyle(fontSize: 12.sp, color: Colors.grey)),
              ],
            ),
          ),
          Expanded(
            child: Column(
              children: [
                Text('${(rate * 100).toStringAsFixed(0)}%', style: TextStyle(fontSize: 18.sp, fontWeight: FontWeight.bold, color: Colors.blue)),
                Text('胜率', style: TextStyle(fontSize: 12.sp, color: Colors.grey)),
              ],
            ),
          ),
        ],
      ),
    );
  }
每个难度显示为一个卡片,包含难度名称、游戏数、胜利数、胜率四列。使用Expanded和flex控制各列的宽度比例。游戏数使用默认颜色,胜利数使用绿色,胜率使用蓝色,通过颜色区分不同类型的数据。
添加图表展示。
              SizedBox(height: 24.h),
              Text('最近7天游戏', style: TextStyle(fontSize: 18.sp, fontWeight: FontWeight.bold)),
              SizedBox(height: 12.h),
              _buildWeeklyChart(controller),
图表可以直观地展示玩家的游戏趋势。最近7天的游戏数据用柱状图展示,让玩家看到自己的活跃程度。
简单柱状图的实现。
  Widget _buildWeeklyChart(StatsController controller) {
    List<int> weeklyData = controller.getWeeklyGames();
    int maxValue = weeklyData.reduce((a, b) => a > b ? a : b);
    if (maxValue == 0) maxValue = 1;

    List<String> weekDays = ['一', '二', '三', '四', '五', '六', '日'];

    return Container(
      height: 150.h,
      padding: EdgeInsets.all(12.w),
      decoration: BoxDecoration(
        color: Colors.white,
        borderRadius: BorderRadius.circular(12.r),
        boxShadow: [
          BoxShadow(
            color: Colors.grey.shade200,
            blurRadius: 4,
            offset: const Offset(0, 2),
          ),
        ],
      ),
      child: Row(
        mainAxisAlignment: MainAxisAlignment.spaceEvenly,
        crossAxisAlignment: CrossAxisAlignment.end,
        children: List.generate(7, (index) {
          double height = (weeklyData[index] / maxValue) * 100.h;
          return Column(
            mainAxisAlignment: MainAxisAlignment.end,
            children: [
              Text(
                weeklyData[index].toString(),
                style: TextStyle(fontSize: 10.sp, color: Colors.grey),
              ),
              SizedBox(height: 4.h),
              Container(
                width: 30.w,
                height: height,
                decoration: BoxDecoration(
                  color: Colors.blue.shade400,
                  borderRadius: BorderRadius.circular(4.r),
                ),
              ),
              SizedBox(height: 4.h),
              Text(
                weekDays[index],
                style: TextStyle(fontSize: 12.sp),
              ),
            ],
          );
        }),
      ),
    );
  }
柱状图使用Row排列7个柱子,每个柱子的高度根据数据值计算。maxValue用于归一化,确保最高的柱子占满可用高度。每个柱子上方显示具体数值,下方显示星期几。这种简单的图表不需要第三方库,用基础组件就能实现。
添加成就系统展示。
              SizedBox(height: 24.h),
              Text('成就', style: TextStyle(fontSize: 18.sp, fontWeight: FontWeight.bold)),
              SizedBox(height: 12.h),
              _buildAchievements(controller),
成就系统可以增加游戏的趣味性,给玩家设定目标。
成就列表的实现。
  Widget _buildAchievements(StatsController controller) {
    List<Map<String, dynamic>> achievements = [
      {
        'title': '初学者',
        'description': '完成第一局游戏',
        'icon': Icons.school,
        'unlocked': controller.totalGames >= 1,
      },
      {
        'title': '坚持不懈',
        'description': '完成10局游戏',
        'icon': Icons.fitness_center,
        'unlocked': controller.totalGames >= 10,
      },
      {
        'title': '连胜达人',
        'description': '达成5连胜',
        'icon': Icons.local_fire_department,
        'unlocked': controller.bestStreak >= 5,
      },
      {
        'title': '速度之星',
        'description': '在3分钟内完成简单难度',
        'icon': Icons.speed,
        'unlocked': (controller.bestTimeByDifficulty['Easy'] ?? 999) <= 180,
      },
      {
        'title': '专家挑战者',
        'description': '完成一局专家难度',
        'icon': Icons.emoji_events,
        'unlocked': (controller.winsByDifficulty['Expert'] ?? 0) >= 1,
      },
    ];

    return Column(
      children: achievements.map((achievement) {
        return _buildAchievementCard(
          achievement['title'],
          achievement['description'],
          achievement['icon'],
          achievement['unlocked'],
        );
      }).toList(),
    );
  }
成就列表定义了多个成就,每个成就有标题、描述、图标和解锁条件。通过检查统计数据判断成就是否已解锁。这种数据驱动的设计让添加新成就变得简单。
成就卡片的实现。
  Widget _buildAchievementCard(String title, String description, IconData icon, bool unlocked) {
    return Container(
      margin: EdgeInsets.only(bottom: 8.h),
      padding: EdgeInsets.all(12.w),
      decoration: BoxDecoration(
        color: unlocked ? Colors.amber.shade50 : Colors.grey.shade100,
        borderRadius: BorderRadius.circular(8.r),
        border: unlocked
            ? Border.all(color: Colors.amber, width: 1)
            : null,
      ),
      child: Row(
        children: [
          Icon(
            icon,
            size: 32.sp,
            color: unlocked ? Colors.amber : Colors.grey,
          ),
          SizedBox(width: 12.w),
          Expanded(
            child: Column(
              crossAxisAlignment: CrossAxisAlignment.start,
              children: [
                Text(
                  title,
                  style: TextStyle(
                    fontSize: 16.sp,
                    fontWeight: FontWeight.bold,
                    color: unlocked ? Colors.black : Colors.grey,
                  ),
                ),
                Text(
                  description,
                  style: TextStyle(
                    fontSize: 12.sp,
                    color: unlocked ? Colors.grey.shade700 : Colors.grey,
                  ),
                ),
              ],
            ),
          ),
          if (unlocked)
            Icon(Icons.check_circle, color: Colors.green, size: 24.sp),
        ],
      ),
    );
  }
已解锁的成就使用金色背景和边框,图标也是金色。未解锁的成就使用灰色调,视觉上明显区分。已解锁的成就右侧显示绿色勾选图标。这种设计让玩家一眼就能看出哪些成就已经达成。
添加下拉刷新功能。
Widget build(BuildContext context) {
return Scaffold(
appBar: AppBar(title: const Text('统计')),
body: RefreshIndicator(
onRefresh: () async {
await Get.find<StatsController>().loadStats();
},
child: SingleChildScrollView(
physics: const AlwaysScrollableScrollPhysics(),
padding: EdgeInsets.all(16.w),
child: Column(
// ... 统计内容
),
),
),
);
}
RefreshIndicator添加下拉刷新功能,用户可以手动刷新统计数据。AlwaysScrollableScrollPhysics确保即使内容不足以滚动也能触发下拉刷新。onRefresh回调中调用controller的loadStats方法重新加载数据。
统计页面的空状态处理。
  Widget _buildEmptyState() {
    return Center(
      child: Column(
        mainAxisAlignment: MainAxisAlignment.center,
        children: [
          Icon(Icons.bar_chart, size: 80.sp, color: Colors.grey.shade300),
          SizedBox(height: 16.h),
          Text(
            '还没有游戏记录',
            style: TextStyle(fontSize: 18.sp, color: Colors.grey),
          ),
          SizedBox(height: 8.h),
          Text(
            '完成一局游戏后这里会显示统计数据',
            style: TextStyle(fontSize: 14.sp, color: Colors.grey.shade400),
          ),
          SizedBox(height: 24.h),
          ElevatedButton(
            onPressed: () {
              // 跳转到游戏页面
            },
            child: const Text('开始游戏'),
          ),
        ],
      ),
    );
  }
当没有游戏记录时显示空状态页面,包含图标、提示文字和开始游戏按钮。这种设计比显示一堆0更友好,引导新用户开始游戏。
总结一下统计主界面的关键设计要点。首先是数据分类展示,将统计数据按类型分组,使用卡片和标题区分。其次是视觉层次,重要数据使用大字体和醒目颜色,次要信息使用小字体和灰色。然后是图表辅助,用简单的柱状图展示趋势数据。最后是成就系统,通过成就激励玩家持续游戏。
统计页面是玩家了解自己游戏表现的窗口。通过清晰的数据展示和有趣的成就系统,我们可以让玩家更有动力继续游戏,追求更好的成绩。
在实际开发中,统计数据的计算和存储也是重要的技术点。让我们来看StatsController的实现。
class StatsController extends GetxController {
  int totalGames = 0;
  int totalWins = 0;
  int currentStreak = 0;
  int bestStreak = 0;

  Map<String, int> gamesByDifficulty = {
    'Easy': 0,
    'Medium': 0,
    'Hard': 0,
    'Expert': 0,
  };

  Map<String, int> winsByDifficulty = {
    'Easy': 0,
    'Medium': 0,
    'Hard': 0,
    'Expert': 0,
  };
StatsController管理所有统计数据。totalGames和totalWins记录总游戏数和胜利数。currentStreak和bestStreak记录连胜数据。两个Map分别记录各难度的游戏数和胜利数。这种数据结构让统计计算变得简单直接。
记录游戏结果的方法。
  void recordGame({
    required String difficulty,
    required int time,
    required int hintsUsed,
    required bool won,
  }) {
    totalGames++;
    gamesByDifficulty[difficulty] = (gamesByDifficulty[difficulty] ?? 0) + 1;

    if (won) {
      totalWins++;
      winsByDifficulty[difficulty] = (winsByDifficulty[difficulty] ?? 0) + 1;
      currentStreak++;
      if (currentStreak > bestStreak) {
        bestStreak = currentStreak;
      }
      _updateAverageTime(difficulty, time);
    } else {
      currentStreak = 0;
    }

    _saveStats();
    update();
  }
recordGame在每局游戏结束后调用。更新总游戏数和对应难度的游戏数。如果胜利,更新胜利数和连胜数,并更新平均用时。如果失败,重置连胜。最后保存数据并更新UI。
平均用时的计算。
  Map<String, List<int>> _timeRecords = {
    'Easy': [],
    'Medium': [],
    'Hard': [],
    'Expert': [],
  };

  void _updateAverageTime(String difficulty, int time) {
    _timeRecords[difficulty]?.add(time);
    if ((_timeRecords[difficulty]?.length ?? 0) > 100) {
      _timeRecords[difficulty]?.removeAt(0);
    }
  }

  int averageTime(String difficulty) {
    List<int> times = _timeRecords[difficulty] ?? [];
    if (times.isEmpty) return 0;
    return times.reduce((a, b) => a + b) ~/ times.length;
  }
_timeRecords存储每个难度最近100局的用时记录。_updateAverageTime添加新记录,如果超过100条则移除最早的。averageTime计算平均值。这种滑动窗口的设计让平均用时反映最近的表现,而不是历史所有数据。
胜率的计算。
  double get winRate {
    if (totalGames == 0) return 0;
    return totalWins / totalGames;
  }

  double winRateByDifficulty(String difficulty) {
    int games = gamesByDifficulty[difficulty] ?? 0;
    int wins = winsByDifficulty[difficulty] ?? 0;
    if (games == 0) return 0;
    return wins / games;
  }
winRate是总胜率的getter,winRateByDifficulty计算指定难度的胜率。都需要处理除零的情况。返回0到1之间的小数,UI显示时乘以100转换为百分比。
时间格式化的方法。
  String formatTime(int seconds) {
    if (seconds == 0) return '--:--';
    int minutes = seconds ~/ 60;
    int secs = seconds % 60;
    return '${minutes.toString().padLeft(2, '0')}:${secs.toString().padLeft(2, '0')}';
  }
formatTime将秒数转换为"MM:SS"格式。如果秒数为0,返回"–:–"表示没有数据。padLeft确保分钟和秒数都是两位数。这个方法在UI中多处使用。
统计数据的持久化。
  Future<void> _saveStats() async {
    final prefs = await SharedPreferences.getInstance();
    await prefs.setInt('totalGames', totalGames);
    await prefs.setInt('totalWins', totalWins);
    await prefs.setInt('currentStreak', currentStreak);
    await prefs.setInt('bestStreak', bestStreak);
    await prefs.setString('gamesByDifficulty', jsonEncode(gamesByDifficulty));
    await prefs.setString('winsByDifficulty', jsonEncode(winsByDifficulty));
    await prefs.setString('timeRecords', jsonEncode(_timeRecords));
  }
_saveStats将所有统计数据保存到SharedPreferences。简单类型直接保存,Map类型需要先转换为JSON字符串。这个方法在每次recordGame后调用,确保数据不会丢失。
加载统计数据。
  Future<void> loadStats() async {
    final prefs = await SharedPreferences.getInstance();
    totalGames = prefs.getInt('totalGames') ?? 0;
    totalWins = prefs.getInt('totalWins') ?? 0;
    currentStreak = prefs.getInt('currentStreak') ?? 0;
    bestStreak = prefs.getInt('bestStreak') ?? 0;

    String? gamesJson = prefs.getString('gamesByDifficulty');
    if (gamesJson != null) {
      gamesByDifficulty = Map<String, int>.from(jsonDecode(gamesJson));
    }

    String? winsJson = prefs.getString('winsByDifficulty');
    if (winsJson != null) {
      winsByDifficulty = Map<String, int>.from(jsonDecode(winsJson));
    }

    update();
  }
loadStats从SharedPreferences读取保存的数据。使用??运算符提供默认值。JSON字符串需要解码并转换为正确的类型。这个方法在应用启动时调用。
清除统计数据的方法。
  Future<void> clearStats() async {
    totalGames = 0;
    totalWins = 0;
    currentStreak = 0;
    bestStreak = 0;
    gamesByDifficulty = {'Easy': 0, 'Medium': 0, 'Hard': 0, 'Expert': 0};
    winsByDifficulty = {'Easy': 0, 'Medium': 0, 'Hard': 0, 'Expert': 0};
    _timeRecords = {'Easy': [], 'Medium': [], 'Hard': [], 'Expert': []};

    final prefs = await SharedPreferences.getInstance();
    await prefs.remove('totalGames');
    await prefs.remove('totalWins');
    await prefs.remove('currentStreak');
    await prefs.remove('bestStreak');
    await prefs.remove('gamesByDifficulty');
    await prefs.remove('winsByDifficulty');
    await prefs.remove('timeRecords');

    update();
  }
}
clearStats重置所有统计数据并清除本地存储。这个方法在设置页面的"清除数据"功能中调用。用户需要确认后才能执行,因为这是不可逆的操作。
统计页面的动画效果可以提升视觉体验。
class AnimatedStatCard extends StatefulWidget {
final String title;
final int value;
final IconData icon;
const AnimatedStatCard({
super.key,
required this.title,
required this.value,
required this.icon,
});
State<AnimatedStatCard> createState() => _AnimatedStatCardState();
}
class _AnimatedStatCardState extends State<AnimatedStatCard>
with SingleTickerProviderStateMixin {
late AnimationController _controller;
late Animation<int> _animation;
AnimatedStatCard为统计数字添加计数动画。当页面加载时,数字从0增长到目标值,给用户一种数据正在加载的感觉。
动画的配置和构建。
void initState() {
super.initState();
_controller = AnimationController(
duration: const Duration(milliseconds: 1000),
vsync: this,
);
_animation = IntTween(begin: 0, end: widget.value).animate(
CurvedAnimation(parent: _controller, curve: Curves.easeOutCubic),
);
_controller.forward();
}
Widget build(BuildContext context) {
return AnimatedBuilder(
animation: _animation,
builder: (context, child) {
return _buildCard(_animation.value.toString());
},
);
}
动画时长1秒,使用easeOutCubic曲线让数字增长先快后慢。AnimatedBuilder监听动画变化并重建UI。这种动画效果让统计页面更加生动有趣。
总结一下统计主界面的完整技术体系。UI层使用卡片、图表、成就徽章等组件展示数据。数据层使用StatsController管理统计计算和持久化。动画层为数字变化添加视觉效果。这三层的配合让统计页面既功能完整又体验良好。通过合理的数据结构设计和计算逻辑,我们可以为玩家提供丰富的游戏数据分析,激励他们持续游戏并追求更好的成绩。
欢迎加入开源鸿蒙跨平台社区:https://openharmonycrossplatform.csdn.net

开源鸿蒙跨平台开发社区汇聚开发者与厂商,共建“一次开发,多端部署”的开源生态,致力于降低跨端开发门槛,推动万物智联创新。
更多推荐
 3
3 0
0- 0


 已为社区贡献30条内容

所有评论(0)