Flutter for OpenHarmony 身体健康状况记录App实战 - 统计概览实现
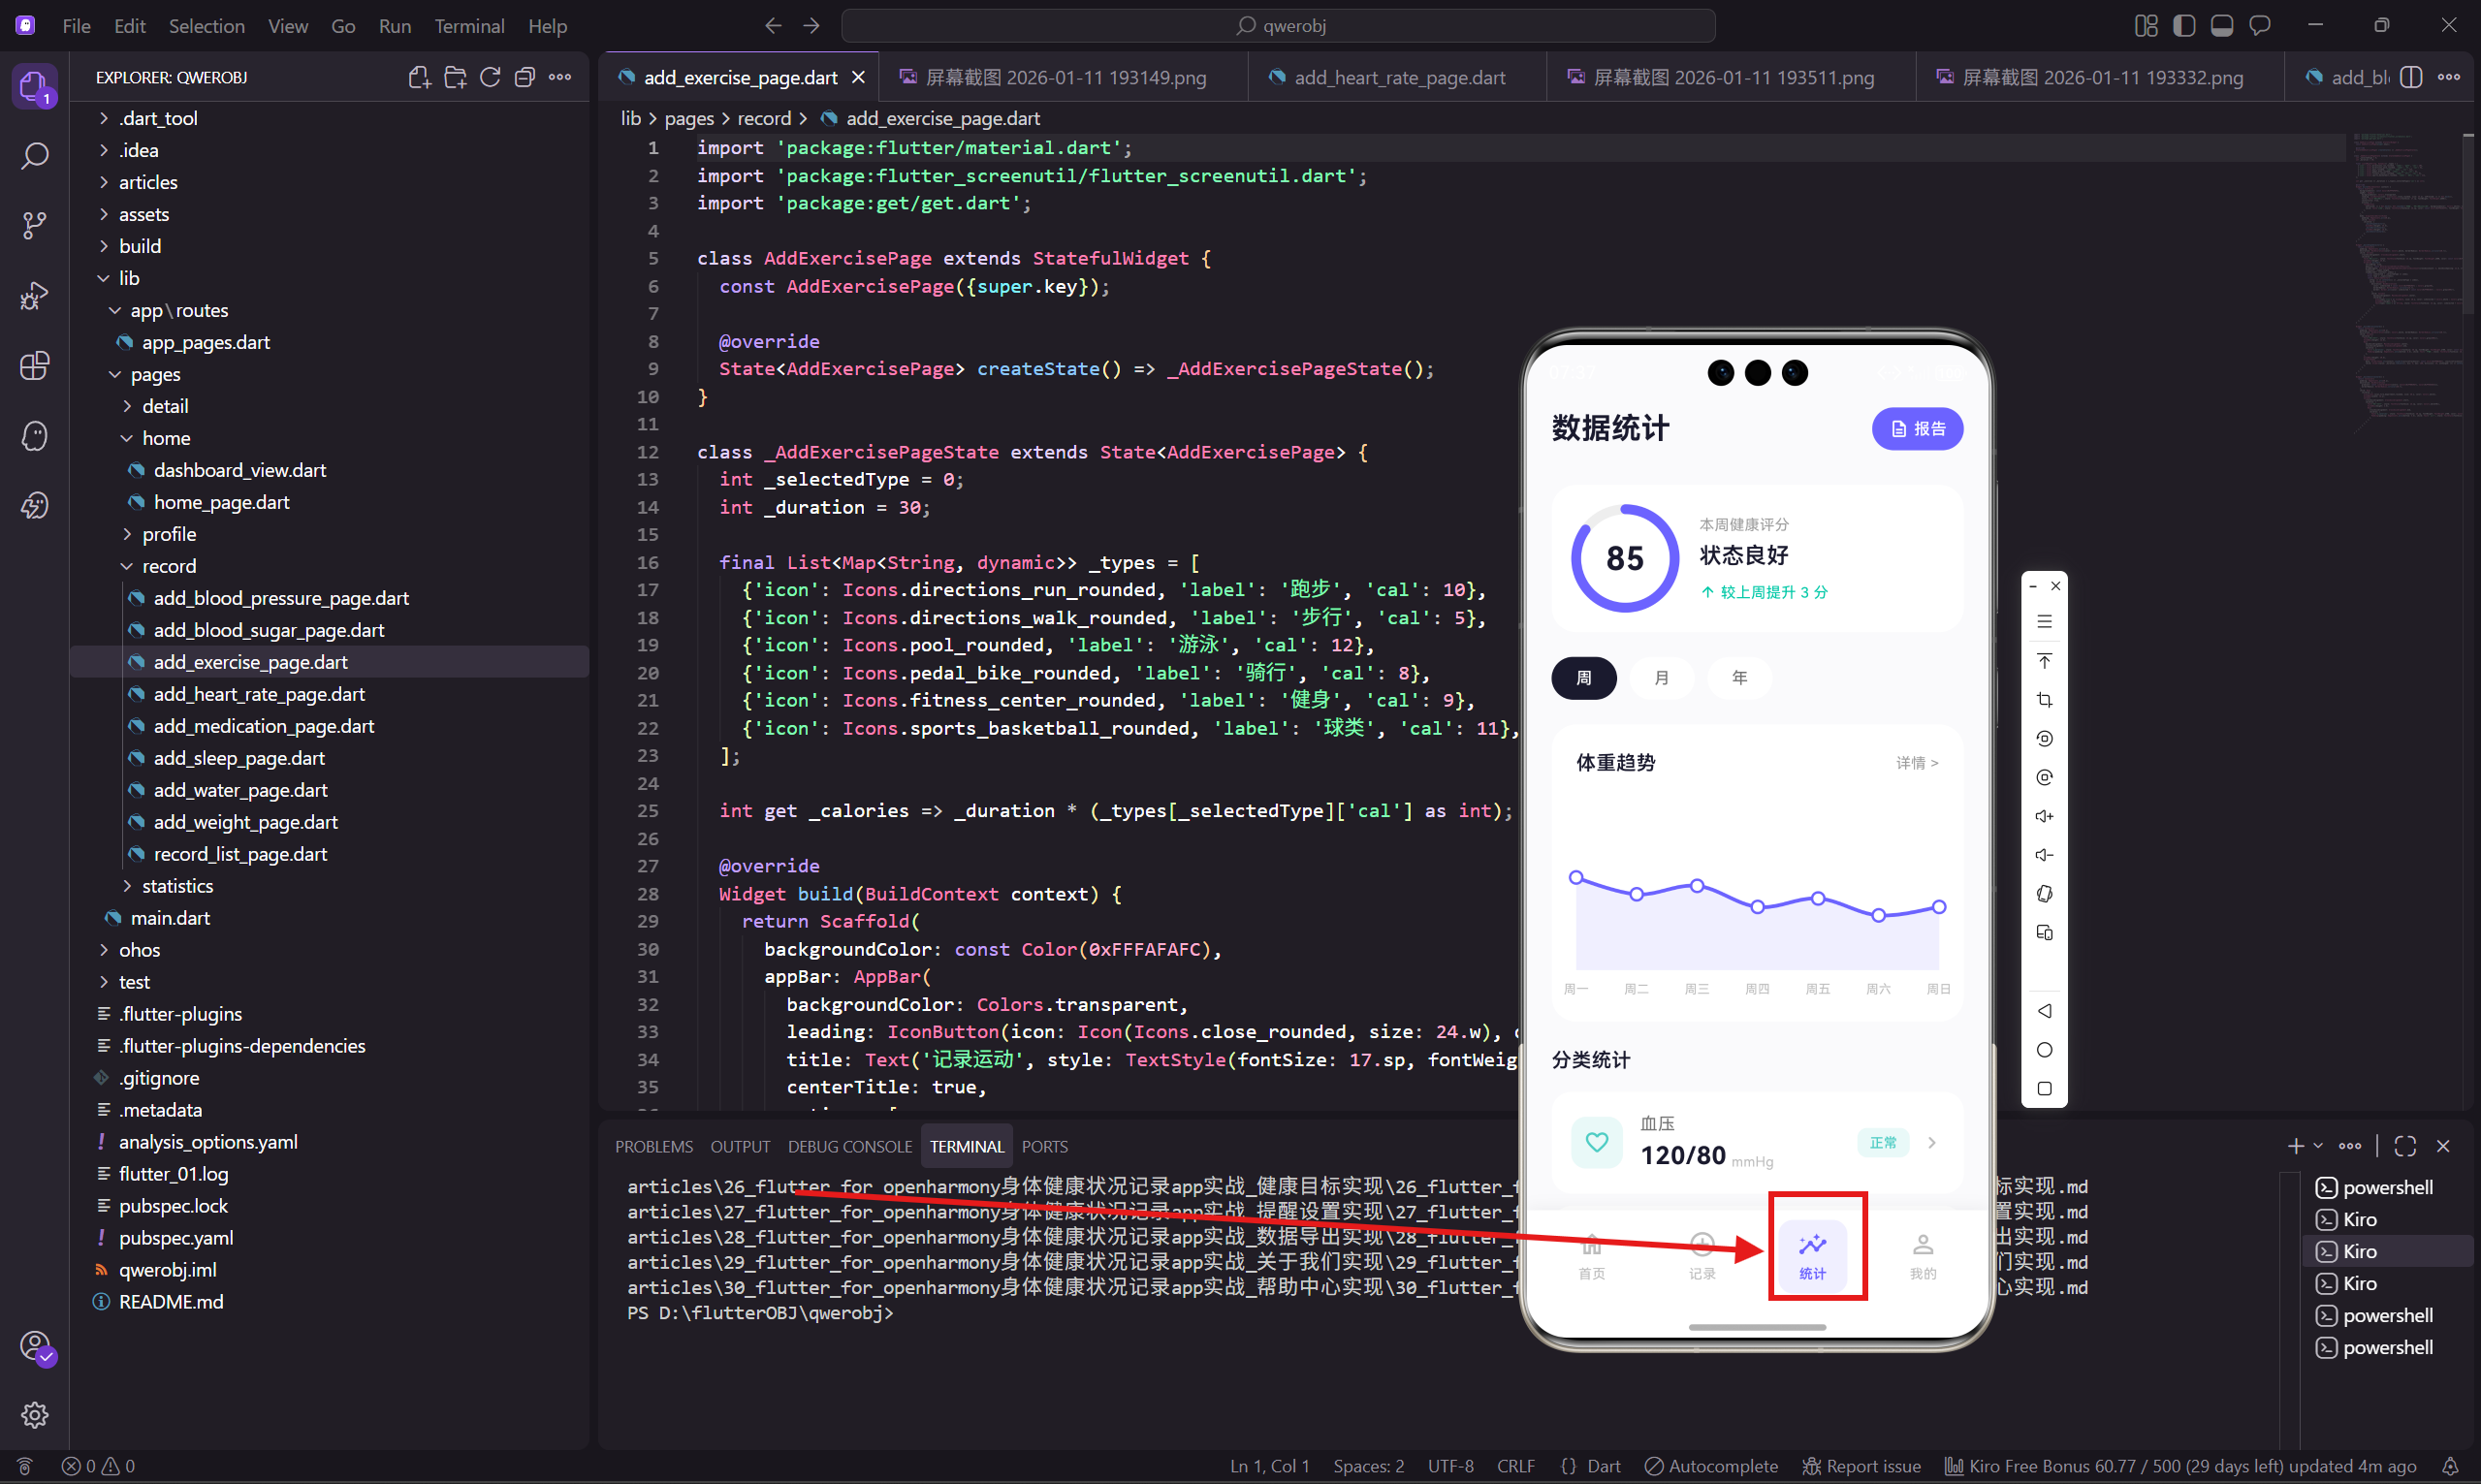
摘要 统计概览页面展示用户健康数据,包含健康评分卡片、周期选择器和趋势图表。健康评分卡片使用圆形进度条(85分)和文字说明,周期选择器支持周/月/年切换,体重趋势图提供跳转详情功能。页面采用白色卡片式设计,通过色彩对比和胶囊按钮提升交互体验,数据可视化帮助用户快速了解健康状况。
·
前言
统计概览页面是数据分析的入口,展示用户的健康评分、各项指标的汇总数据和趋势图表。用户可以从这里跳转到更详细的分析页面。
页面状态
统计页面需要维护时间周期选择的状态。
class StatisticsOverviewPage extends StatefulWidget {
const StatisticsOverviewPage({super.key});
State<StatisticsOverviewPage> createState() => _StatisticsOverviewPageState();
}
class _StatisticsOverviewPageState extends State<StatisticsOverviewPage> {
int _selectedPeriod = 0;
final List<String> _periods = ['周', '月', '年'];
三个时间周期:周、月、年。不同周期显示不同范围的数据。
健康评分卡片
用圆形进度条展示健康评分。
  Widget _buildScoreCard() {
    return Container(
      margin: EdgeInsets.all(20.w),
      padding: EdgeInsets.all(20.w),
      decoration: BoxDecoration(
        color: Colors.white,
        borderRadius: BorderRadius.circular(20.r),
      ),
      child: Row(
        children: [
          SizedBox(
            width: 80.w,
            height: 80.w,
            child: Stack(
              children: [
                SizedBox(
                  width: 80.w,
                  height: 80.w,
                  child: CircularProgressIndicator(
                    value: 0.85,
                    strokeWidth: 8.w,
                    backgroundColor: Colors.grey[200],
                    valueColor: const AlwaysStoppedAnimation(Color(0xFF6C63FF)),
                    strokeCap: StrokeCap.round,
                  ),
                ),
                Center(child: Text('85', style: TextStyle(
                  fontSize: 26.sp,
                  fontWeight: FontWeight.w700,
                  color: const Color(0xFF1A1A2E)
                ))),
              ],
            ),
          ),
CircularProgressIndicator 用作圆形进度条,strokeCap: StrokeCap.round 让端点变成圆形。用 Stack 把分数文字叠加在进度条中心。
评分说明
在进度条右边显示评分的文字说明。
          SizedBox(width: 20.w),
          Expanded(
            child: Column(
              crossAxisAlignment: CrossAxisAlignment.start,
              children: [
                Text('本周健康评分', style: TextStyle(
                  fontSize: 12.sp,
                  color: Colors.grey[500]
                )),
                SizedBox(height: 4.h),
                Text('状态良好', style: TextStyle(
                  fontSize: 18.sp,
                  fontWeight: FontWeight.w600,
                  color: const Color(0xFF1A1A2E)
                )),
                SizedBox(height: 8.h),
                Row(
                  children: [
                    Icon(Icons.arrow_upward_rounded, size: 14.w,
                      color: const Color(0xFF00C9A7)),
                    Text(' 较上周提升 3 分', style: TextStyle(
                      fontSize: 12.sp,
                      color: const Color(0xFF00C9A7)
                    )),
                  ],
                ),
              ],
            ),
          ),
        ],
      ),
    );
  }
绿色向上箭头表示评分提升,这种正向反馈能激励用户继续保持健康习惯。
周期选择器
让用户切换查看不同时间范围的数据。
  Widget _buildPeriodSelector() {
    return Padding(
      padding: EdgeInsets.symmetric(horizontal: 20.w),
      child: Row(
        children: List.generate(_periods.length, (index) {
          final isSelected = _selectedPeriod == index;
          return GestureDetector(
            onTap: () => setState(() => _selectedPeriod = index),
            child: Container(
              margin: EdgeInsets.only(right: 10.w),
              padding: EdgeInsets.symmetric(horizontal: 20.w, vertical: 8.h),
              decoration: BoxDecoration(
                color: isSelected ? const Color(0xFF1A1A2E) : Colors.white,
                borderRadius: BorderRadius.circular(20.r),
              ),
              child: Text(_periods[index], style: TextStyle(
                fontSize: 13.sp,
                color: isSelected ? Colors.white : Colors.grey[600],
                fontWeight: FontWeight.w500
              )),
            ),
          );
        }),
      ),
    );
  }
选中的周期用深色背景,未选中的用白色背景。胶囊形状的按钮看起来更现代。
体重趋势图
展示一周的体重变化趋势。
  Widget _buildWeightChart() {
    return Container(
      margin: EdgeInsets.all(20.w),
      padding: EdgeInsets.all(20.w),
      decoration: BoxDecoration(
        color: Colors.white,
        borderRadius: BorderRadius.circular(20.r),
      ),
      child: Column(
        crossAxisAlignment: CrossAxisAlignment.start,
        children: [
          Row(
            mainAxisAlignment: MainAxisAlignment.spaceBetween,
            children: [
              Text('体重趋势', style: TextStyle(
                fontSize: 16.sp,
                fontWeight: FontWeight.w600,
                color: const Color(0xFF1A1A2E)
              )),
              GestureDetector(
                onTap: () => Get.toNamed('/weight-trend'),
                child: Text('详情 >', style: TextStyle(
                  fontSize: 12.sp,
                  color: Colors.grey[500]
                )),
              ),
            ],
          ),
          SizedBox(height: 20.h),
          SizedBox(
            height: 160.h,
            child: LineChart(
              LineChartData(
                gridData: FlGridData(show: false),
                titlesData: FlTitlesData(
                  rightTitles: AxisTitles(sideTitles: SideTitles(showTitles: false)),
                  topTitles: AxisTitles(sideTitles: SideTitles(showTitles: false)),
                  leftTitles: AxisTitles(sideTitles: SideTitles(showTitles: false)),
                  bottomTitles: AxisTitles(
                    sideTitles: SideTitles(
                      showTitles: true,
                      getTitlesWidget: (v, m) => Padding(
                        padding: EdgeInsets.only(top: 8.h),
                        child: Text(
                          ['周一', '周二', '周三', '周四', '周五', '周六', '周日'][v.toInt() % 7],
                          style: TextStyle(fontSize: 10.sp, color: Colors.grey[400])
                        ),
                      ),
                    ),
                  ),
                ),
                borderData: FlBorderData(show: false),
                lineBarsData: [
                  LineChartBarData(
                    spots: const [
                      FlSpot(0, 66.2), FlSpot(1, 65.8), FlSpot(2, 66.0),
                      FlSpot(3, 65.5), FlSpot(4, 65.7), FlSpot(5, 65.3), FlSpot(6, 65.5)
                    ],
                    isCurved: true,
                    color: const Color(0xFF6C63FF),
                    barWidth: 3,
                    dotData: FlDotData(
                      show: true,
                      getDotPainter: (spot, percent, barData, index) => FlDotCirclePainter(
                        radius: 4,
                        color: Colors.white,
                        strokeWidth: 2,
                        strokeColor: const Color(0xFF6C63FF)
                      ),
                    ),
                    belowBarData: BarAreaData(
                      show: true,
                      color: const Color(0xFF6C63FF).withOpacity(0.1)
                    ),
                  ),
                ],
                minY: 64, maxY: 68,
              ),
            ),
          ),
        ],
      ),
    );
  }
图表右上角有"详情 >"链接,点击跳转到体重趋势详情页面。
分类统计卡片
展示血压、睡眠、运动等分类的汇总数据。
  Widget _buildCategoryStats() {
    final stats = [
      {'title': '血压', 'value': '120/80', 'unit': 'mmHg', 'status': '正常',
       'icon': Icons.favorite_border_rounded, 'color': const Color(0xFF4ECDC4),
       'route': '/blood-pressure-trend'},
      {'title': '睡眠', 'value': '7.2', 'unit': '小时/天', 'status': '良好',
       'icon': Icons.nightlight_outlined, 'color': const Color(0xFF845EC2),
       'route': '/sleep-analysis'},
      {'title': '运动', 'value': '156', 'unit': '分钟/周', 'status': '达标',
       'icon': Icons.directions_run_rounded, 'color': const Color(0xFF00C9A7),
       'route': '/exercise-analysis'},
    ];

    return Padding(
      padding: EdgeInsets.symmetric(horizontal: 20.w),
      child: Column(
        crossAxisAlignment: CrossAxisAlignment.start,
        children: [
          Text('分类统计', style: TextStyle(
            fontSize: 16.sp,
            fontWeight: FontWeight.w600,
            color: const Color(0xFF1A1A2E)
          )),
          SizedBox(height: 14.h),
          ...stats.map((stat) => GestureDetector(
            onTap: () => Get.toNamed(stat['route'] as String),
            child: Container(
              margin: EdgeInsets.only(bottom: 10.h),
              padding: EdgeInsets.all(16.w),
              decoration: BoxDecoration(
                color: Colors.white,
                borderRadius: BorderRadius.circular(16.r),
              ),
              child: Row(
                children: [
                  Container(
                    padding: EdgeInsets.all(10.w),
                    decoration: BoxDecoration(
                      color: (stat['color'] as Color).withOpacity(0.12),
                      borderRadius: BorderRadius.circular(12.r),
                    ),
                    child: Icon(stat['icon'] as IconData, size: 22.w,
                      color: stat['color'] as Color),
                  ),
                  SizedBox(width: 14.w),
                  Expanded(
                    child: Column(
                      crossAxisAlignment: CrossAxisAlignment.start,
                      children: [
                        Text(stat['title'] as String, style: TextStyle(
                          fontSize: 14.sp,
                          color: Colors.grey[600]
                        )),
                        SizedBox(height: 2.h),
                        Row(
                          crossAxisAlignment: CrossAxisAlignment.end,
                          children: [
                            Text(stat['value'] as String, style: TextStyle(
                              fontSize: 20.sp,
                              fontWeight: FontWeight.w700,
                              color: const Color(0xFF1A1A2E)
                            )),
                            SizedBox(width: 4.w),
                            Padding(
                              padding: EdgeInsets.only(bottom: 2.h),
                              child: Text(stat['unit'] as String, style: TextStyle(
                                fontSize: 11.sp,
                                color: Colors.grey[400]
                              )),
                            ),
                          ],
                        ),
                      ],
                    ),
                  ),
                  Container(
                    padding: EdgeInsets.symmetric(horizontal: 10.w, vertical: 4.h),
                    decoration: BoxDecoration(
                      color: (stat['color'] as Color).withOpacity(0.12),
                      borderRadius: BorderRadius.circular(8.r),
                    ),
                    child: Text(stat['status'] as String, style: TextStyle(
                      fontSize: 11.sp,
                      color: stat['color'] as Color,
                      fontWeight: FontWeight.w500
                    )),
                  ),
                  SizedBox(width: 8.w),
                  Icon(Icons.chevron_right_rounded, size: 20.w, color: Colors.grey[400]),
                ],
              ),
            ),
          )),
        ],
      ),
    );
  }
}
每个分类卡片都可以点击跳转到对应的详细分析页面。状态标签用各自的主题色,和图标颜色一致。
小结
统计概览页面的特点:
- 圆形进度条展示健康评分
- 周期选择器切换数据范围
- 体重趋势图表
- 分类统计卡片,可跳转详情
这个页面是数据分析的入口,让用户快速了解整体健康状况,然后可以深入查看感兴趣的具体指标。
欢迎加入开源鸿蒙跨平台社区:https://openharmonycrossplatform.csdn.net

开源鸿蒙跨平台开发社区汇聚开发者与厂商,共建“一次开发,多端部署”的开源生态,致力于降低跨端开发门槛,推动万物智联创新。
更多推荐


 13
13 0
0- 0


 已为社区贡献30条内容

所有评论(0)