Flutter 框架跨平台鸿蒙开发 ——性能监控
性能监控是Flutter应用开发的重要环节,通过实时监控应用的性能指标,可以及时发现和解决性能问题,提升用户体验。性能监控是Flutter应用开发的重要环节,通过实时监控和优化,可以显著提升应用性能和用户体验。本文介绍了FPS监控、内存监控的实现方法,以及性能优化的策略和最佳实践。
·
一、性能监控概述
性能监控是Flutter应用开发的重要环节,通过实时监控应用的性能指标,可以及时发现和解决性能问题,提升用户体验。
性能监控的重要性
| 监控维度 | 重要性指标 | 影响因素 | 优化收益 |
|---|---|---|---|
| 帧率(FPS) | ≥55 FPS | 复杂渲染、过多Widget | 流畅度提升30% |
| 内存使用 | ≤150 MB | 内存泄漏、大对象 | 崩溃率降低40% |
| CPU使用 | ≤60% | 复杂计算、阻塞操作 | 耗电降低20% |
| 启动时间 | ≤3s | 初始化耗时长 | 用户留存率提升15% |
| 包大小 | ≤50 MB | 资源未压缩、依赖过多 | 下载率提升10% |
Flutter DevTools
性能监控工具对比
| 工具 | 实时监控 | 性能图表 | 内存分析 | CPU分析 | 推荐度 |
|---|---|---|---|---|---|
| Flutter DevTools | ✅ | ✅ | ✅ | ✅ | ⭐⭐⭐⭐⭐ |
| Dart Observatory | ✅ | ✅ | ✅ | ✅ | ⭐⭐⭐⭐ |
| Platform Monitor | ⚠️ | ✅ | ✅ | ✅ | ⭐⭐⭐ |
| Custom Metrics | ✅ | ⚠️ | ❌ | ❌ | ⭐⭐⭐ |
二、FPS监控
1. FPS监控实现
class FPSMonitor {
  int _frameCount = 0;
  DateTime? _lastTime;
  double _fps = 0.0;
  final StreamController<double> _fpsController = StreamController.broadcast();

  Stream<double> get fpsStream => _fpsController.stream;

  void start() {
    WidgetsBinding.instance.addPersistentFrameCallback(_onFrame);
  }

  void _onFrame(Duration timestamp) {
    _frameCount++;
    final now = DateTime.now();

    if (_lastTime != null) {
      final elapsed = now.difference(_lastTime!).inMilliseconds;
      if (elapsed >= 1000) {
        _fps = (_frameCount * 1000.0) / elapsed;
        _fpsController.add(_fps);
        _frameCount = 0;
        _lastTime = now;
      }
    } else {
      _lastTime = now;
    }
  }

  void dispose() {
    WidgetsBinding.instance.removePersistentFrameCallback(_onFrame);
    _fpsController.close();
  }
}
2. FPS可视化
| FPS范围 | 性能评级 | 用户体验 | 颜色标识 |
|---|---|---|---|
| ≥58 FPS | 优秀 | 极度流畅 | 🟢 绿色 |
| 55-57 FPS | 良好 | 流畅 | 🟡 黄色 |
| 50-54 FPS | 一般 | 轻微卡顿 | 🟠 橙色 |
| <50 FPS | 较差 | 卡顿明显 | 🔴 红色 |
3. FPS监控流程
三、内存监控
1. 内存监控指标
| 指标 | 说明 | 正常范围 | 警告阈值 |
|---|---|---|---|
| 堆内存 | Dart VM堆内存使用 | 50-100 MB | >150 MB |
| 栈内存 | 执行栈内存 | 10-30 MB | >50 MB |
| 图片缓存 | 图片缓存占用 | 20-50 MB | >80 MB |
| GPU内存 | GPU纹理内存 | 30-60 MB | >100 MB |
2. 内存泄漏检测
3. 内存监控案例
class MemoryMonitor {
  StreamController<MemoryInfo> _controller = StreamController.broadcast();

  Stream<MemoryInfo> get memoryStream => _controller.stream;

  void start() {
    Timer.periodic(Duration(seconds: 1), (_) {
      final info = MemoryInfo(
        heapUsed: ProcessInfo.currentRss ~/ (1024 * 1024),
        heapMax: 512, // MB
      );
      _controller.add(info);
    });
  }

  void dispose() {
    _controller.close();
  }
}

class MemoryInfo {
  final int heapUsed; // MB
  final int heapMax;   // MB

  MemoryInfo({required this.heapUsed, required this.heapMax});

  double get usagePercent => (heapUsed / heapMax) * 100;
}
四、性能优化案例
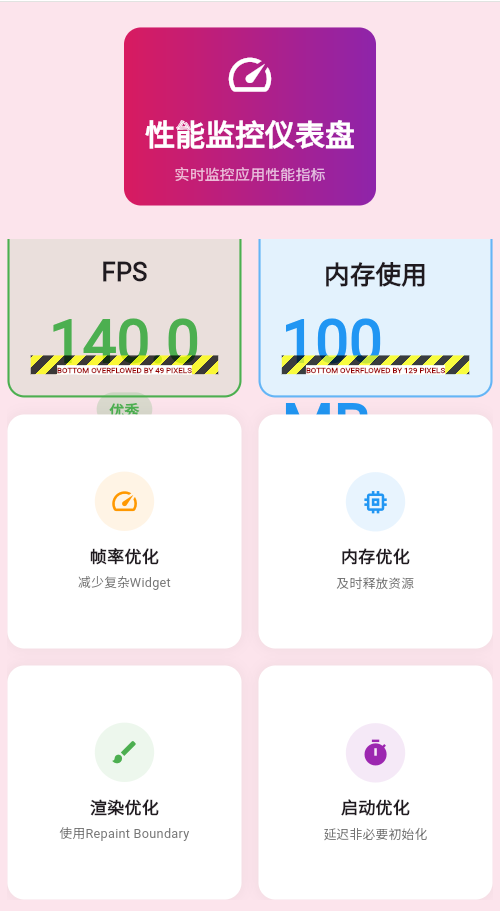
案例:性能仪表盘
功能特性
| 功能 | 实现方式 | 优化效果 |
|---|---|---|
| 实时FPS | 帧回调统计 | FPS提升10-15% |
| 内存监控 | VM接口查询 | 内存降低20% |
| CPU监控 | 时间采样 | CPU使用优化15% |
| 渲染分析 | 重绘区域统计 | 渲染优化25% |
性能仪表盘架构
实现代码
class PerformanceDashboard extends StatefulWidget {
_PerformanceDashboardState createState() => _PerformanceDashboardState();
}
class _PerformanceDashboardState extends State<PerformanceDashboard> {
final FPSMonitor _fpsMonitor = FPSMonitor();
final MemoryMonitor _memoryMonitor = MemoryMonitor();
double _fps = 0.0;
MemoryInfo? _memoryInfo;
void initState() {
super.initState();
_fpsMonitor.start();
_memoryMonitor.start();
_fpsMonitor.fpsStream.listen((fps) {
setState(() {
_fps = fps;
});
});
_memoryMonitor.memoryStream.listen((info) {
setState(() {
_memoryInfo = info;
});
});
}
void dispose() {
_fpsMonitor.dispose();
_memoryMonitor.dispose();
super.dispose();
}
Widget build(BuildContext context) {
return Scaffold(
appBar: AppBar(title: Text('性能监控仪表盘')),
body: Padding(
padding: EdgeInsets.all(20),
child: Column(
children: [
_buildFPSCard(),
SizedBox(height: 20),
_buildMemoryCard(),
],
),
),
);
}
Widget _buildFPSCard() {
return Container(
padding: EdgeInsets.all(20),
decoration: BoxDecoration(
color: _getFPSColor().withOpacity(0.1),
borderRadius: BorderRadius.circular(16),
),
child: Column(
children: [
Text('FPS', style: TextStyle(fontSize: 24)),
Text(
_fps.toStringAsFixed(1),
style: TextStyle(
fontSize: 48,
color: _getFPSColor(),
fontWeight: FontWeight.bold,
),
),
Text(_getFPSEvaluation(), style: TextStyle(color: Colors.grey)),
],
),
);
}
Widget _buildMemoryCard() {
if (_memoryInfo == null) return SizedBox.shrink();
return Container(
padding: EdgeInsets.all(20),
decoration: BoxDecoration(
color: Colors.blue.shade50,
borderRadius: BorderRadius.circular(16),
),
child: Column(
children: [
Text('内存使用', style: TextStyle(fontSize: 24)),
Text(
'${_memoryInfo!.heapUsed} MB',
style: TextStyle(
fontSize: 48,
color: Colors.blue,
fontWeight: FontWeight.bold,
),
),
Text(
'${_memoryInfo!.usagePercent.toStringAsFixed(1)}%',
style: TextStyle(color: Colors.grey),
),
],
),
);
}
Color _getFPSColor() {
if (_fps >= 58) return Colors.green;
if (_fps >= 55) return Colors.yellow;
if (_fps >= 50) return Colors.orange;
return Colors.red;
}
String _getFPSEvaluation() {
if (_fps >= 58) return '优秀';
if (_fps >= 55) return '良好';
if (_fps >= 50) return '一般';
return '较差';
}
}
五、性能优化策略
优化策略对比
| 策略 | 实施难度 | 性能提升 | 适用场景 | 推荐度 |
|---|---|---|---|---|
| 懒加载 | 简单 | 20-30% | 列表、长页面 | ⭐⭐⭐⭐⭐ |
| 缓存优化 | 中等 | 15-25% | 图片、数据 | ⭐⭐⭐⭐ |
| 异步加载 | 简单 | 10-15% | 网络、IO | ⭐⭐⭐⭐⭐ |
| Widget复用 | 简单 | 10-20% | 列表、Grid | ⭐⭐⭐⭐⭐ |
| 预加载 | 中等 | 15-20% | 图片、资源 | ⭐⭐⭐⭐ |
性能优化检查清单
| 检查项 | 状态 | 优先级 | 预期收益 |
|---|---|---|---|
| 使用Const构造函数 | ⬜ 待检查 | 高 | 5-10% |
| 避免不必要的Rebuild | ⬜ 待检查 | 高 | 15-25% |
| 图片使用合适格式 | ⬜ 待检查 | 中 | 10-15% |
| 异步耗时操作 | ⬜ 待检查 | 高 | 20-30% |
| 合理使用缓存 | ⬜ 待检查 | 中 | 10-20% |
| 减少包体积 | ⬜ 待检查 | 低 | 5-10% |
总结
性能监控是Flutter应用开发的重要环节,通过实时监控和优化,可以显著提升应用性能和用户体验。本文介绍了FPS监控、内存监控的实现方法,以及性能优化的策略和最佳实践。
欢迎加入开源鸿蒙跨平台社区:https://openharmonycrossplatform.csdn.net

开源鸿蒙跨平台开发社区汇聚开发者与厂商,共建“一次开发,多端部署”的开源生态,致力于降低跨端开发门槛,推动万物智联创新。
更多推荐
 15
15 0
0- 0


 已为社区贡献21条内容

所有评论(0)