Windows/Linux Qwt 绘制曲线
一、环境1.windows编译器:VS2010Qt:5.5.1 32位。下载地址:http://download.qt.io/archive/qt/5.5/5.5.1/2.Linux编译器:GCCQt:5.5.1 64位。下载地址:http://download.qt.io/archive/qt/5.5/5.5.1/二、Qwt 下载编译下载地址:ht...
一、环境
1.windows
编译器:VS2010
Qt:5.5.1 32位。下载地址:http://download.qt.io/archive/qt/5.5/5.5.1/
2.Linux
编译器:GCC
Qt:5.5.1 64位。下载地址:http://download.qt.io/archive/qt/5.5/5.5.1/
二、Qwt 下载编译
下载地址:https://sourceforge.net/projects/qwt/files/qwt/ 这个地址包含windows跟Linux下的包。这个只是源码,没有编译的二进制文件。
1.windows下编译。打开pro文件直接生成,然后执行下列步骤(测试demo里面已经配置好,无需再配置)
(1)、将C:\Qt\5.5.1\qwt-6.1.2\lib的qwtd.dll、qwt.dll拷贝到C:\Qt\5.5.1\bin目录下,将qwtd.lib、qwt.lib拷贝C:\Qt\5.5.1\\lib目录下。qwtd.dll是我们在Debug模式需要设置的lib文件;
(2)、再将C:\Qt\5.5.1\qwt-6.1.2\designer\plugins\designer目录下的qwt_designer_plugin.dll和qwt_designer_plugin.lib拷贝到C:\Qt\5.5.1\plugins\designer目录下;
(3)、再将C:\Qt\5.5.1\qwt-6.1.2\src目录下的所有文件拷贝到C:\Qt\5.5.1\include\QWT目录下(新建一个QWT目录)。这样就完成了Qwt的编译和基本配置工作了,可以运行一下QWT下面的编译好的示例试试。
2.Linux下编译
cd qwt-6.1.4
/usr/local/Qt-5.5.1/bin/qmake qwt.pro
make
三、绘图
#ifndef IDRAWCURVE_H
#define IDRAWCURVE_H

#include <QTimer>
#include <QWidget>
#include <QBitmap>
#include <QPixmap>
#include <QPalette>
#include <QPainter>
#include <QDateTime>

#include <qwt.h>
#include <qwt_plot.h>
#include <qwt_legend.h>
#include <qwt_plot_curve.h>
#include <qwt_plot_canvas.h>
#include <qwt_plot_picker.h>
#include <qwt_plot_layout.h>
#include <qwt_scale_widget.h>
#include <qwt_date_scale_draw.h>

#define MAX_ARRAY_SIZE	1024

class IDrawCurve:public QWidget
{
	Q_OBJECT

public:
	IDrawCurve(QWidget *parent = 0);

public:
	void InitCharts(QWidget *pWidget, bool bShowLegend, long nWidth, long nHeight);
	void InitCharts(QWidget *pWidget, bool bShowLegend, long nLeftMargin, long nTopMargin, long nRightMargin, long nBottomMargin);
	void EnableAxisXTick(bool bValue);
	void EnableAxisYTick(bool bValue);
	void SetAxisXMaxMajor(long nValue);
	void SetAxisYMaxMajor(long nValue);
	void SetAxisXMaxMinor(long nValue);
	void SetAxisYMaxMinor(long nValue);
	void SetAxisXScale(long nMinValue, long nMaxValue);
	void SetAxisYScale(long nMinValue, long nMaxValue);
	void SetAxisXTitle(const QString& qstrTitle);
	void SetAxisYTitle(const QString& qstrTitle);

	void Draw();
	void SetAutoReplot(bool bValue);//设置是否自动绘图
	void SetAxisYAutoScale(bool bValue);//设置Y坐标轴自动伸缩
	void SetChartsStyle(const QString& qstrChartsStyle);
	void SetCanvasStyle(const QString& qstrCanvasStyle);
	void LinkLineOfLowerLeftCorner();//左下角的X轴跟Y轴连线

public:
	void InitCurve(long nCurveNumber, QString* qstrTitle);
	void SetCurveData(long nCurveIndex, long nValue);
	void SetCurveParam(long nCurveIndex, long nLineWidth = 2, QColor color = Qt::black);

private:
	void LinkLineOfLowerLeftCorner(long nAxis);//左下角的X轴跟Y轴连线

private:
	bool m_bAutoReplot;
	bool m_bAxisYAutoScale;

private:
	long m_nCurveNumber;
	long m_nWidth;
	long m_nHeight;

private:
	QWidget* m_pParentWidget;//父窗口指针

private:
	QPolygonF m_pointData[MAX_ARRAY_SIZE];

private:
	QwtPlot* m_pCharts;
	QwtPlotCanvas* m_pCanvas;
	QwtPlotCurve* m_pCurve[MAX_ARRAY_SIZE];
};

#endif // IDRAWCURVE_H
#include "IDrawCurve.h"

#define AXIS_OFFSET		1//该值不允许修改
class HScaleDraw: public QwtScaleDraw        //自画坐标轴
{
public:
	HScaleDraw(){};

	virtual QwtText label(double v) const  //重绘坐标轴 刻度值
	{
		//if(v == 0){
		//	return QwtText(QString(""));//X轴跟Y轴公用一个原点(0)
		//}
		return QwtText(QString::number(v));  //默认的 大刻度的时候 才会显示
	}
	virtual void drawBackbone(QPainter * painter) const
	{
		QPen pen;
		pen.setWidth(3);
		pen.setBrush(QColor(0, 0xea, 0xff));

		painter->setPen(pen);
		painter->drawLine(this->pos().rx(), this->pos().ry(), this->pos().rx() + this->length(), this->pos().ry());//向下偏移2个像素以对应Y轴
	}
	virtual void drawTick( QPainter *painter, double value, double len ) const
	{
		QPen pen;
		pen.setWidth(1);
		pen.setBrush(QColor(0, 0xea, 0xff));

		painter->setPen(pen);
		return QwtScaleDraw::drawTick(painter, value, len);
	}
};

class VScaleDraw: public QwtScaleDraw        //自画坐标轴
{
public:
	VScaleDraw(){}

	virtual void drawBackbone(QPainter * painter) const
	{
		QPen pen;
		pen.setWidth(3);
		pen.setBrush(QColor(0, 0xea, 0xff));

		painter->setPen(pen);
		painter->drawLine(this->pos().rx(), this->pos().ry(), this->pos().rx(), this->pos().ry() + this->length() + AXIS_OFFSET);
	}
	virtual void drawTick( QPainter *painter, double value, double len ) const
	{
		QPen pen;
		pen.setWidth(1);
		pen.setBrush(QColor(0, 0xea, 0xff));

		painter->setPen(pen);
		return QwtScaleDraw::drawTick(painter, value, len);
	}
};

IDrawCurve::IDrawCurve(QWidget *parent):QWidget(parent)
{
	m_bAutoReplot = false;
	m_bAxisYAutoScale = false;
	m_nCurveNumber = 0;
	m_nWidth = 0;
	m_nHeight = 0;

	m_pParentWidget = NULL;
	m_pCharts = NULL;
	m_pCanvas = NULL;
	for(int i = 0; i < MAX_ARRAY_SIZE; i++){
		m_pointData[i]<<QPoint(0, 0);
		m_pCurve[i] = NULL;
	}
}
void IDrawCurve::InitCharts(QWidget *pWidget, bool bShowLegend, long nWidth, long nHeight)
{
	m_pParentWidget = pWidget;
	m_nWidth = m_pParentWidget->geometry().width();
	m_nHeight = m_pParentWidget->geometry().height();

	//---------------------------------------------------------------------------------------------------------------------//
	m_pCharts = new QwtPlot(m_pParentWidget);
	m_pCharts->setFixedSize(nWidth, nHeight);//通过设置高度来压缩Y轴
	m_pCharts->setAxisScaleDraw(QwtPlot::xBottom, new HScaleDraw());  //不能与自动伸缩同时使用
	m_pCharts->setAxisScaleDraw(QwtPlot::yLeft, new VScaleDraw());  //不能与自动伸缩同时使用
	if(bShowLegend){
		QwtLegend* pLegend = new QwtLegend();
		pLegend->setStyleSheet("color:#00eaff");
		m_pCharts->insertLegend(pLegend);
	}

	//---------------------------------------------------------------------------------------------------------------------//
	m_pCanvas = new QwtPlotCanvas();
	m_pCharts->setCanvas(m_pCanvas);
	m_pCharts->axisWidget(QwtPlot::xBottom)->setStyleSheet(QString("color:#00eaff"));//
	m_pCharts->axisWidget(QwtPlot::yLeft)->setStyleSheet(QString("border-right:%1px;color:#00eaff").arg(AXIS_OFFSET));//补齐原点(左下角)出现的缝隙,参考HScaleDraw类(将横轴向下移动了2个像素)
}
void IDrawCurve::InitCharts(QWidget *pWidget, bool bShowLegend, long nLeftMargin, long nTopMargin, long nRightMargin, long nBottomMargin)
{
	m_pParentWidget = pWidget;
	m_nWidth = m_pParentWidget->geometry().width();
	m_nHeight = m_pParentWidget->geometry().height();

	//---------------------------------------------------------------------------------------------------------------------//
	m_pCharts = new QwtPlot(m_pParentWidget);
	m_pCharts->setGeometry(nLeftMargin, nTopMargin, m_nWidth - nRightMargin, m_nHeight - nBottomMargin);//通过设置高度来压缩Y轴
	m_pCharts->setAxisScaleDraw(QwtPlot::xBottom, new HScaleDraw());  //不能与自动伸缩同时使用
	m_pCharts->setAxisScaleDraw(QwtPlot::yLeft, new VScaleDraw());  //不能与自动伸缩同时使用
	if(bShowLegend){
		QwtLegend* pLegend = new QwtLegend();
		pLegend->setStyleSheet("color:#00eaff");
		m_pCharts->insertLegend(pLegend);
	}

	//---------------------------------------------------------------------------------------------------------------------//
	m_pCanvas = new QwtPlotCanvas();
	m_pCharts->setCanvas(m_pCanvas);
	m_pCharts->axisWidget(QwtPlot::xBottom)->setStyleSheet(QString("color:#00eaff"));//
	m_pCharts->axisWidget(QwtPlot::yLeft)->setStyleSheet(QString("border-right:%1px;color:#00eaff").arg(AXIS_OFFSET));//补齐原点(左下角)出现的缝隙,参考HScaleDraw类(将横轴向下移动了2个像素)
}

//-----------------------------------------------------------------------------------------------------------------------------------------------//
void IDrawCurve::SetAutoReplot(bool bValue)
{
	m_bAutoReplot = bValue;
}
void IDrawCurve::SetAxisYAutoScale(bool bValue)
{
	m_bAxisYAutoScale = bValue;
}

//-----------------------------------------------------------------------------------------------------------------------------------------------//
void IDrawCurve::EnableAxisXTick(bool bValue)
{
	m_pCharts->axisScaleDraw(QwtPlot::xBottom)->enableComponent(QwtAbstractScaleDraw::Ticks, bValue/*是否显示刻度*/);
}
void IDrawCurve::EnableAxisYTick(bool bValue)
{
	m_pCharts->axisScaleDraw(QwtPlot::yLeft)->enableComponent(QwtAbstractScaleDraw::Ticks, bValue/*是否显示刻度*/);
}
void IDrawCurve::SetAxisXMaxMajor(long nValue)
{
	m_pCharts->setAxisMaxMajor(QwtPlot::xBottom, nValue);//设置刻度
}
void IDrawCurve::SetAxisYMaxMajor(long nValue)
{
	m_pCharts->setAxisMaxMajor(QwtPlot::yLeft, nValue);
}
void IDrawCurve::SetAxisXMaxMinor(long nValue)
{
	m_pCharts->setAxisMaxMinor(QwtPlot::xBottom, nValue);//设置大刻度里面的小刻度的值
}
void IDrawCurve::SetAxisYMaxMinor(long nValue)
{
	m_pCharts->setAxisMaxMinor(QwtPlot::yLeft, nValue);//设置大刻度里面的小刻度的值
}
void IDrawCurve::SetAxisXScale(long nMinValue, long nMaxValue)
{
	m_pCharts->setAxisScale(QwtPlot::xBottom, nMinValue, nMaxValue);
}
void IDrawCurve::SetAxisYScale(long nMinValue, long nMaxValue)
{
	m_pCharts->setAxisScale(QwtPlot::yLeft, nMinValue, nMaxValue);//设置最大人员数10000个人
}
void IDrawCurve::SetAxisXTitle(const QString& qstrTitle)
{
	m_pCharts->setAxisTitle(QwtPlot::xBottom, qstrTitle);
}
void IDrawCurve::SetAxisYTitle(const QString& qstrTitle)
{
	m_pCharts->setAxisTitle(QwtPlot::yLeft, qstrTitle);
}
void IDrawCurve::SetChartsStyle(const QString& qstrChartsStyle)
{
	m_pCharts->setStyleSheet(qstrChartsStyle);
}
void IDrawCurve::SetCanvasStyle(const QString& qstrCanvasStyle)
{
	m_pCharts->canvas()->setStyleSheet(QString("%1;%2").arg(qstrCanvasStyle).arg("border:0px;") );//border:0px不让画布出现白色边框
}

void IDrawCurve::LinkLineOfLowerLeftCorner()
{//设置缺角
	LinkLineOfLowerLeftCorner(QwtPlot::xBottom);
	LinkLineOfLowerLeftCorner(QwtPlot::yLeft);
}
void IDrawCurve::LinkLineOfLowerLeftCorner(long nAxis)
{
	QwtScaleWidget *poScaleWidget = m_pCharts->axisWidget(nAxis);
	if (poScaleWidget){
		poScaleWidget->setMargin(0);
	}

	QwtScaleDraw *poScaleDraw = m_pCharts->axisScaleDraw(nAxis);
	if (poScaleDraw){
		poScaleDraw->enableComponent(QwtAbstractScaleDraw::Backbone, true/*是否显示轴线*/);
	}

	m_pCharts->plotLayout()->setAlignCanvasToScales(true);//两个坐标轴和画布之间总是有一点点空隙,去掉
}

//-----------------------------------------------------------------------------------------------------------------------------------------------//
void IDrawCurve::InitCurve(long nCurveNumber, QString* qstrTitle)
{
	m_nCurveNumber = nCurveNumber;
	for(int i = 0; i < nCurveNumber; i++){
		m_pCurve[i] = new QwtPlotCurve();
		m_pCurve[i]->setTitle(qstrTitle[i]);
	}
}
void IDrawCurve::SetCurveData(long nCurveIndex, long nValue)
{
	QDateTime dtCurrent = QDateTime::currentDateTime();
	int pointX = dtCurrent.time().hour();
	int pointY = nValue;
	m_pointData[nCurveIndex]<<QPoint(pointX, pointY);//这里需要加锁
}
void IDrawCurve::SetCurveParam(long nCurveIndex, long nLineWidth, QColor color)
{
	if(nCurveIndex < m_nCurveNumber){
		m_pCurve[nCurveIndex]->setPen(color, nLineWidth);//设置曲线颜色 粗细
		m_pCurve[nCurveIndex]->setRenderHint(QwtPlotItem::RenderAntialiased, true);//线条光滑化
		m_pCurve[nCurveIndex]->attach(m_pCharts);//
		m_pCurve[nCurveIndex]->setLegendAttribute(m_pCurve[nCurveIndex]->LegendShowLine);//显示图例的标志,这里显示线的颜色。
	}
}

//-----------------------------------------------------------------------------------------------------------------------------------------------//
void IDrawCurve::Draw()
{
	QDateTime dtCurrent = QDateTime::currentDateTime();
	if(dtCurrent.time().hour() == 0 && dtCurrent.time().minute() == 0 && dtCurrent.time().second() == 0){//清除数据
		for(int i = 0; i < m_nCurveNumber; i++){
			m_pointData[i].clear();
		}
	}

	for(int i = 0; i < m_nCurveNumber; i++){
		m_pCurve[i]->setSamples(m_pointData[i]);
		if(m_pCharts->canvas() == m_pCanvas){
			m_pCharts->setAxisAutoScale(QwtPlot::yLeft, m_bAxisYAutoScale);
			m_pCharts->replot();
			m_pCharts->setAutoReplot(m_bAutoReplot);
		}
	}
}
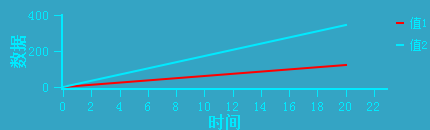
封装完成后,调用封装库显示的图片:
四、测试demo

开源鸿蒙跨平台开发社区汇聚开发者与厂商,共建“一次开发,多端部署”的开源生态,致力于降低跨端开发门槛,推动万物智联创新。
更多推荐


 0
0 0
0- 0


 已为社区贡献2条内容

所有评论(0)