OpenHarmony 与 Flutter 的完美融合财务管理应用:趋势分析模块
OpenHarmony钱包应用v1.7.0新增趋势分析功能,包含日/月趋势视图和趋势摘要卡片。核心功能包括:1) 趋势分析页面支持自定义日期范围筛选交易数据;2) 按日期和月份分组统计收支数据;3) 可视化展示趋势摘要卡片,显示总收入、总支出和净收益(红绿颜色区分盈亏);4) 提供日趋势柱状图展示每日收支变化。该版本通过数据分组统计和可视化图表,帮助用户直观掌握资金流动规律。
·
更新概述
v1.7.0 版本为 OpenHarmony 钱包应用增加了强大的趋势分析功能。用户现在可以在独立的趋势分析页面查看日趋势和月趋势,直观地了解收支变化规律。新增的第四个 Tab 让应用功能更加完整。

核心功能更新
1. 趋势分析页面
页面结构
/// 趋势分析页面
class TrendAnalysisPage extends StatefulWidget {
final List<wallet.Transaction> transactions;
const TrendAnalysisPage({
Key? key,
required this.transactions,
}) : super(key: key);
State<TrendAnalysisPage> createState() => _TrendAnalysisPageState();
}
class _TrendAnalysisPageState extends State<TrendAnalysisPage> {
late DateTime _startDate;
late DateTime _endDate;
void initState() {
super.initState();
_endDate = DateTime.now();
_startDate = DateTime(_endDate.year, _endDate.month - 1, _endDate.day);
}
}
说明:
- 默认显示过去一个月的数据
- 支持自定义日期范围
- 接收交易列表用于分析
日期范围过滤
/// 获取日期范围内的交易
List<wallet.Transaction> _getTransactionsInRange() {
  return widget.transactions.where((t) {
    return t.date.isAfter(_startDate) &&
           t.date.isBefore(_endDate.add(const Duration(days: 1)));
  }).toList();
}
说明:
- 过滤指定日期范围内的交易
- 包含结束日期的整个一天
2. 数据分组统计
按日期分组
/// 按日期分组统计
Map<String, Map<String, double>> _groupByDate() {
  final transactions = _getTransactionsInRange();
  Map<String, Map<String, double>> grouped = {};

  for (var transaction in transactions) {
    final dateKey = '${transaction.date.month}-${transaction.date.day}';
    if (!grouped.containsKey(dateKey)) {
      grouped[dateKey] = {'收入': 0.0, '支出': 0.0};
    }

    if (transaction.type == wallet.TransactionType.income) {
      grouped[dateKey]!['收入'] = grouped[dateKey]!['收入']! + transaction.amount;
    } else {
      grouped[dateKey]!['支出'] = grouped[dateKey]!['支出']! + transaction.amount;
    }
  }

  return grouped;
}
说明:
- 按月-日格式分组
- 每天统计收入和支出
- 返回嵌套 Map 结构
按月份分组
/// 按月份分组统计
Map<String, Map<String, double>> _groupByMonth() {
  final transactions = _getTransactionsInRange();
  Map<String, Map<String, double>> grouped = {};

  for (var transaction in transactions) {
    final dateKey = '${transaction.date.year}-${transaction.date.month.toString().padLeft(2, '0')}';
    if (!grouped.containsKey(dateKey)) {
      grouped[dateKey] = {'收入': 0.0, '支出': 0.0};
    }

    if (transaction.type == wallet.TransactionType.income) {
      grouped[dateKey]!['收入'] = grouped[dateKey]!['收入']! + transaction.amount;
    } else {
      grouped[dateKey]!['支出'] = grouped[dateKey]!['支出']! + transaction.amount;
    }
  }

  return grouped;
}
说明:
- 按年-月格式分组
- 每月统计收入和支出
- 支持跨年份数据
3. 趋势摘要卡片
摘要卡片设计
/// 构建趋势摘要
Widget _buildTrendSummary() {
  final transactions = _getTransactionsInRange();
  double totalIncome = 0;
  double totalExpense = 0;

  for (var t in transactions) {
    if (t.type == wallet.TransactionType.income) {
      totalIncome += t.amount;
    } else {
      totalExpense += t.amount;
    }
  }

  final trend = totalIncome - totalExpense;
  final trendColor = trend >= 0 ? Colors.green : Colors.red;

  return Padding(
    padding: const EdgeInsets.symmetric(horizontal: 16),
    child: Container(
      padding: const EdgeInsets.all(20),
      decoration: BoxDecoration(
        gradient: LinearGradient(
          colors: [Colors.teal.shade400, Colors.teal.shade800],
          begin: Alignment.topLeft,
          end: Alignment.bottomRight,
        ),
        borderRadius: BorderRadius.circular(20),
        boxShadow: [
          BoxShadow(
            color: Colors.teal.withOpacity(0.3),
            blurRadius: 10,
            offset: const Offset(0, 5),
          ),
        ],
      ),
      child: Column(
        crossAxisAlignment: CrossAxisAlignment.start,
        children: [
          Text(
            '趋势摘要',
            style: Theme.of(context).textTheme.titleMedium?.copyWith(
                  color: Colors.white,
                  fontWeight: FontWeight.bold,
                ),
          ),
          const SizedBox(height: 20),
          Row(
            mainAxisAlignment: MainAxisAlignment.spaceBetween,
            children: [
              _buildTrendStatItem('总收入', totalIncome, Colors.green),
              _buildTrendStatItem('总支出', totalExpense, Colors.orange),
              _buildTrendStatItem('净收益', trend, trendColor),
            ],
          ),
        ],
      ),
    ),
  );
}
说明:
- 青色渐变背景,区别于其他页面
- 显示总收入、总支出、净收益
- 净收益为正时绿色,为负时红色

4. 日趋势图表
日趋势柱状图
/// 构建日趋势图表
Widget _buildDailyTrendChart(Map<String, Map<String, double>> dailyData) {
  if (dailyData.isEmpty) {
    return Padding(
      padding: const EdgeInsets.all(32),
      child: Center(
        child: Text(
          '暂无数据',
          style: Theme.of(context).textTheme.bodyMedium?.copyWith(
                color: Colors.grey,
              ),
        ),
      ),
    );
  }

  final sortedKeys = dailyData.keys.toList()..sort();
  final maxValue = dailyData.values
      .map((v) => math.max(v['收入']!, v['支出']!))
      .reduce((a, b) => math.max(a, b));

  return Padding(
    padding: const EdgeInsets.symmetric(horizontal: 16),
    child: Column(
      crossAxisAlignment: CrossAxisAlignment.start,
      children: [
        Text(
          '日趋势',
          style: Theme.of(context).textTheme.titleMedium?.copyWith(
                fontWeight: FontWeight.bold,
              ),
        ),
        const SizedBox(height: 16),
        SizedBox(
          height: 200,
          child: ListView.builder(
            scrollDirection: Axis.horizontal,
            itemCount: sortedKeys.length,
            itemBuilder: (context, index) {
              final key = sortedKeys[index];
              final data = dailyData[key]!;
              final income = data['收入']!;
              final expense = data['支出']!;

              return Padding(
                padding: const EdgeInsets.symmetric(horizontal: 8),
                child: Column(
                  mainAxisAlignment: MainAxisAlignment.end,
                  children: [
                    Expanded(
                      child: Column(
                        mainAxisAlignment: MainAxisAlignment.end,
                        children: [
                          if (income > 0)
                            Container(
                              width: 20,
                              height: (income / maxValue) * 150,
                              decoration: BoxDecoration(
                                color: Colors.green,
                                borderRadius: BorderRadius.circular(4),
                              ),
                            ),
                          if (expense > 0)
                            Container(
                              width: 20,
                              height: (expense / maxValue) * 150,
                              decoration: BoxDecoration(
                                color: Colors.red,
                                borderRadius: BorderRadius.circular(4),
                              ),
                              margin: const EdgeInsets.only(top: 4),
                            ),
                        ],
                      ),
                    ),
                    const SizedBox(height: 8),
                    Text(
                      key,
                      style: const TextStyle(fontSize: 10),
                    ),
                  ],
                ),
              );
            },
          ),
        ),
      ],
    ),
  );
}
说明:
- 水平可滚动的柱状图
- 绿色柱表示收入,红色柱表示支出
- 柱高度按最大值归一化
- 显示月-日标签
5. 月趋势对比
月趋势列表
/// 构建月趋势图表
Widget _buildMonthlyTrendChart(Map<String, Map<String, double>> monthlyData) {
  if (monthlyData.isEmpty) {
    return const SizedBox.shrink();
  }

  final sortedKeys = monthlyData.keys.toList()..sort();

  return Padding(
    padding: const EdgeInsets.symmetric(horizontal: 16),
    child: Column(
      crossAxisAlignment: CrossAxisAlignment.start,
      children: [
        Text(
          '月趋势',
          style: Theme.of(context).textTheme.titleMedium?.copyWith(
                fontWeight: FontWeight.bold,
              ),
        ),
        const SizedBox(height: 16),
        ...sortedKeys.map((month) {
          final data = monthlyData[month]!;
          final income = data['收入']!;
          final expense = data['支出']!;
          final net = income - expense;

          return Padding(
            padding: const EdgeInsets.symmetric(vertical: 12),
            child: Column(
              crossAxisAlignment: CrossAxisAlignment.start,
              children: [
                Row(
                  mainAxisAlignment: MainAxisAlignment.spaceBetween,
                  children: [
                    Text(
                      month,
                      style: const TextStyle(
                        fontSize: 14,
                        fontWeight: FontWeight.w500,
                      ),
                    ),
                    Text(
                      '收入: ¥${income.toStringAsFixed(2)} | 支出: ¥${expense.toStringAsFixed(2)}',
                      style: const TextStyle(fontSize: 12, color: Colors.grey),
                    ),
                  ],
                ),
                const SizedBox(height: 8),
                Row(
                  children: [
                    Expanded(
                      flex: (income * 10).toInt(),
                      child: Container(
                        height: 20,
                        decoration: BoxDecoration(
                          color: Colors.green,
                          borderRadius: BorderRadius.circular(4),
                        ),
                      ),
                    ),
                    const SizedBox(width: 4),
                    Expanded(
                      flex: (expense * 10).toInt(),
                      child: Container(
                        height: 20,
                        decoration: BoxDecoration(
                          color: Colors.red,
                          borderRadius: BorderRadius.circular(4),
                        ),
                      ),
                    ),
                  ],
                ),
                const SizedBox(height: 4),
                Text(
                  '净收益: ¥${net.toStringAsFixed(2)}',
                  style: TextStyle(
                    fontSize: 12,
                    color: net >= 0 ? Colors.green : Colors.red,
                    fontWeight: FontWeight.w500,
                  ),
                ),
              ],
            ),
          );
        }).toList(),
      ],
    ),
  );
}
说明:
- 显示每月的收入和支出
- 并排条形图对比收支
- 显示月净收益
- 支持多个月份对比
UI 变化
Tab 导航更新
- 新增第四个 Tab:趋势分析
- 图标:折线图图标
- 标签:趋势
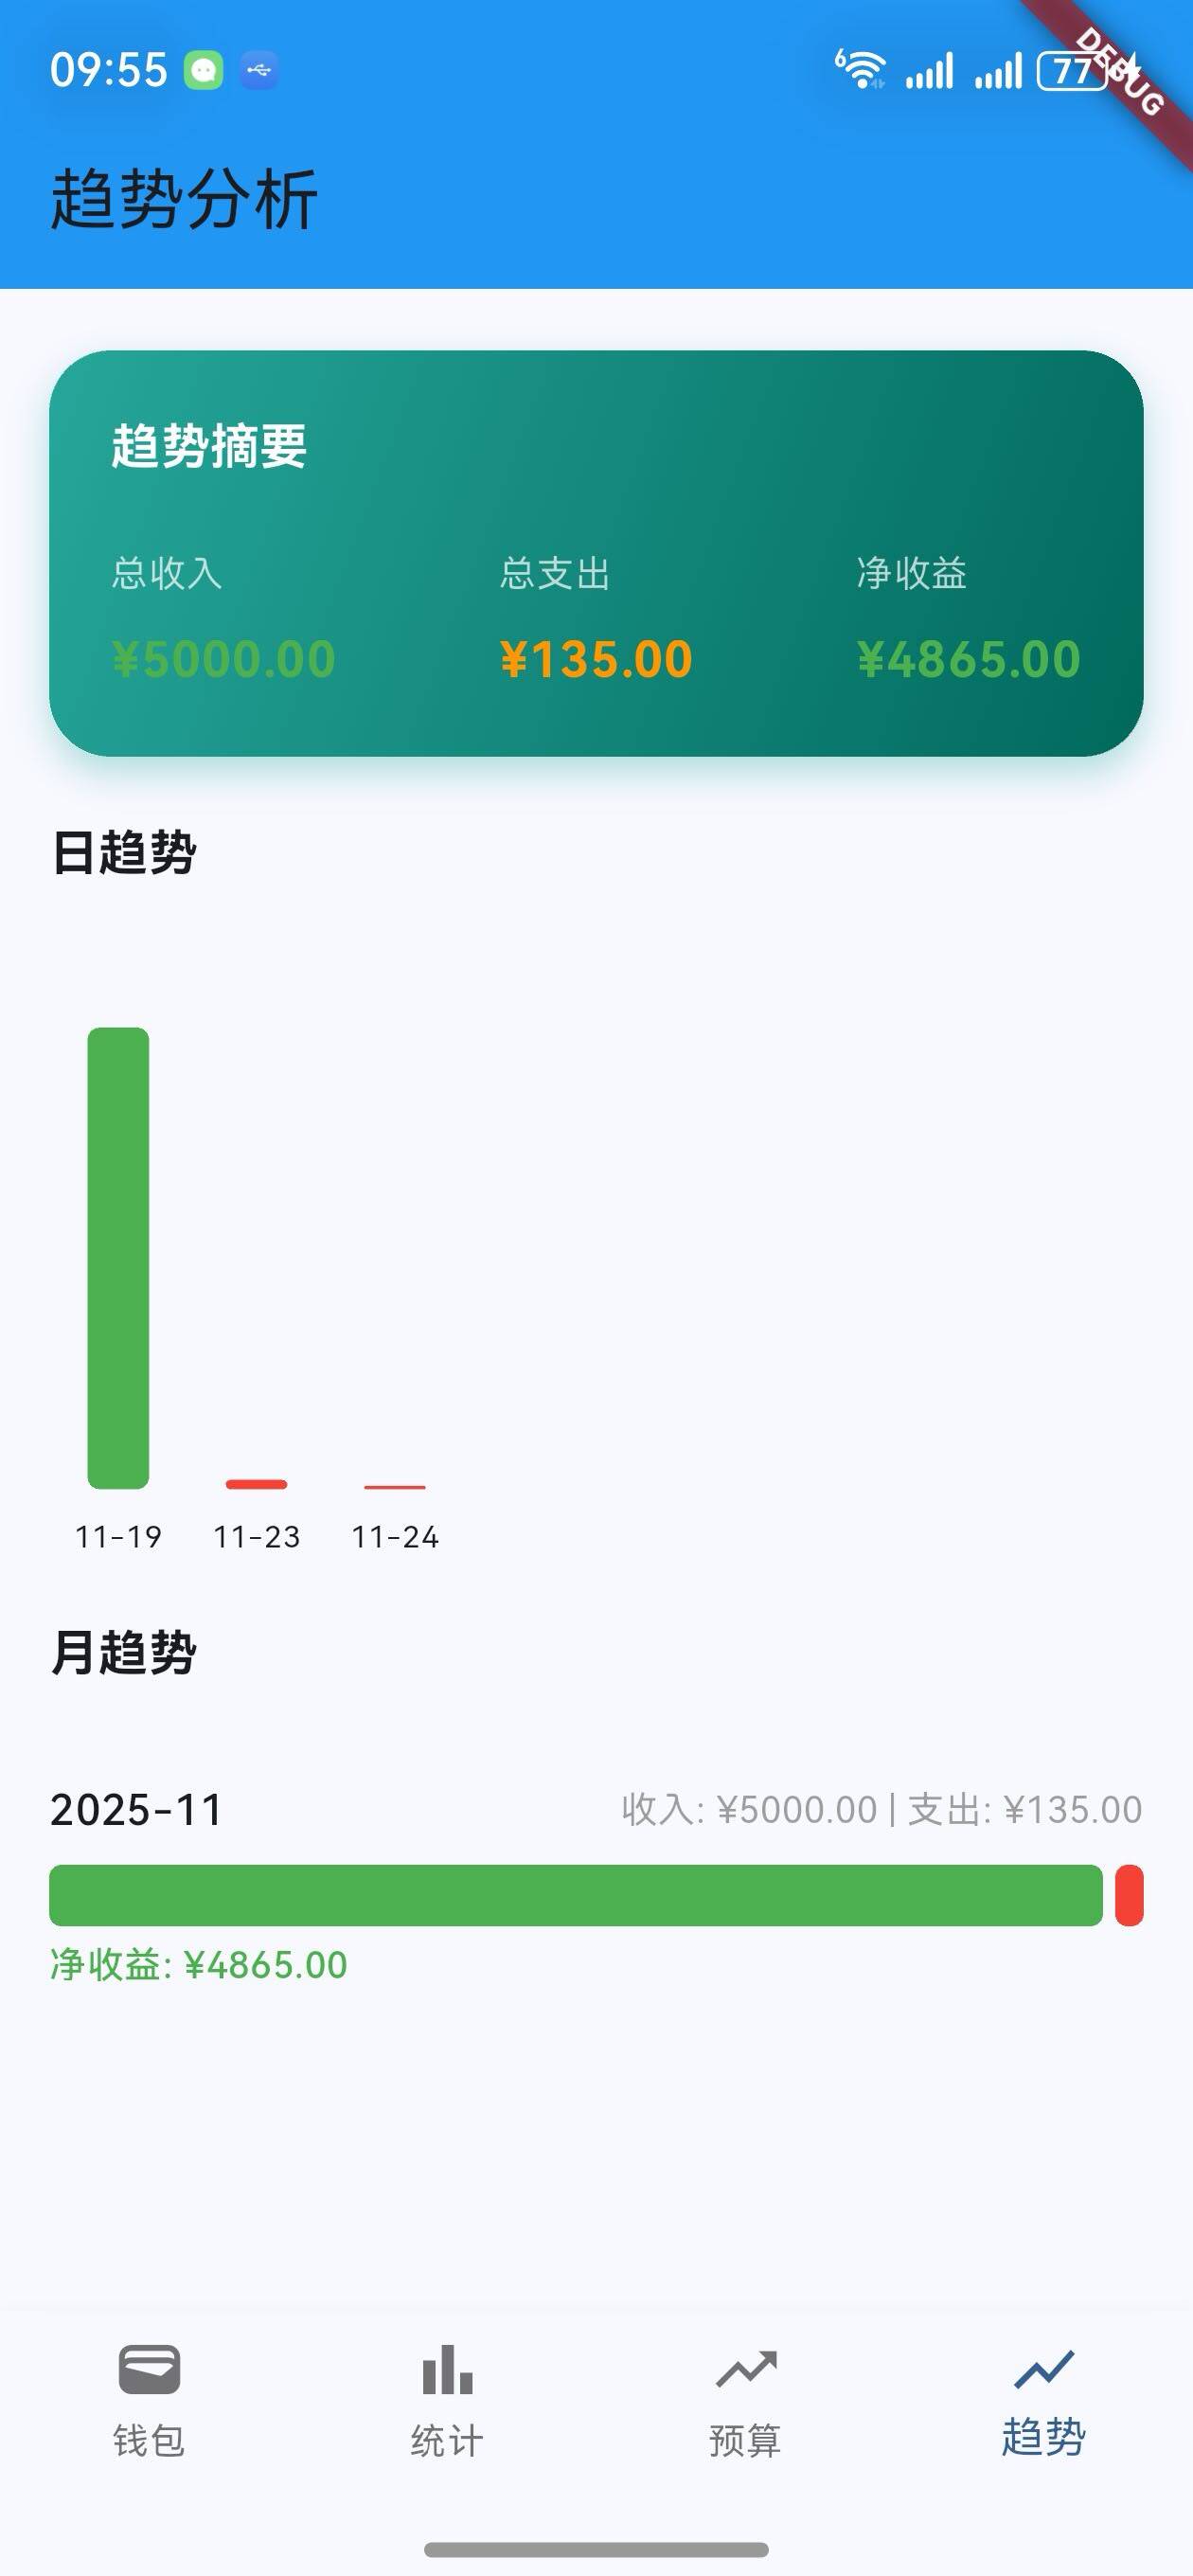
趋势分析页面布局
┌─────────────────────────────────┐
│  趋势分析                        │
├─────────────────────────────────┤
│  ┌─────────────────────────┐   │
│  │  趋势摘要               │   │
│  │  总收入: ¥5000          │   │
│  │  总支出: ¥135           │   │
│  │  净收益: ¥4865          │   │
│  └─────────────────────────┘   │
├─────────────────────────────────┤
│  日趋势                          │
│  ⬜ ⬜ ⬜ ⬜ ⬜ ⬜ ⬜ ⬜         │
│  12-1 12-2 12-3 12-4 ...      │
├─────────────────────────────────┤
│  月趋势                          │
│  2024-11                        │
│  [🟢🟢🟢🟢🟢🟢🔴🔴] ¥4865      │
│  2024-12                        │
│  [🟢🟢🟢🟢🟢🔴🔴🔴] ¥4865      │
└─────────────────────────────────┘
技术实现细节
数据分组算法
Map<String, Map<String, double>> grouped = {};

for (var transaction in transactions) {
  final dateKey = '${transaction.date.month}-${transaction.date.day}';
  if (!grouped.containsKey(dateKey)) {
    grouped[dateKey] = {'收入': 0.0, '支出': 0.0};
  }

  // 累加金额
  if (transaction.type == wallet.TransactionType.income) {
    grouped[dateKey]!['收入'] = grouped[dateKey]!['收入']! + transaction.amount;
  } else {
    grouped[dateKey]!['支出'] = grouped[dateKey]!['支出']! + transaction.amount;
  }
}
说明:
- 使用 Map 作为分组容器
- 嵌套 Map 存储收入和支出
- 按类型累加金额
柱状图高度计算
final maxValue = dailyData.values
    .map((v) => math.max(v['收入']!, v['支出']!))
    .reduce((a, b) => math.max(a, b));

final height = (income / maxValue) * 150;
说明:
- 找出所有数据中的最大值
- 按比例计算柱高度
- 确保所有柱都在视图范围内
条形图宽度计算
Expanded(
  flex: (income * 10).toInt(),
  child: Container(...)
)
说明:
- 使用
flex属性按比例分配宽度 - 乘以 10 放大差异
- 自动适应容器宽度
版本对比
| 功能 | v1.6.0 | v1.7.0 |
|---|---|---|
| 底部 Tab 导航 | ✅ | ✅ |
| 预算管理页面 | ✅ | ✅ |
| 分类预算设置 | ✅ | ✅ |
| 预算超支提醒 | ✅ | ✅ |
| 多页面架构 | ✅ | ✅ |
| 趋势分析页面 | ❌ | ✅ |
| 日趋势图表 | ❌ | ✅ |
| 月趋势对比 | ❌ | ✅ |
| 趋势摘要 | ❌ | ✅ |
| 第四个 Tab | ❌ | ✅ |
下一步计划
v1.8.0 将继续增强功能,计划增加:
- 💾 数据导出功能(CSV/PDF)
- 🏷️ 标签管理
- 🔔 预算提醒通知
- 📱 数据同步功能
感谢使用 OpenHarmony 钱包! 🎉
如有建议或问题,欢迎反馈。

开源鸿蒙跨平台开发社区汇聚开发者与厂商,共建“一次开发,多端部署”的开源生态,致力于降低跨端开发门槛,推动万物智联创新。
更多推荐
 14
14 0
0- 0


 已为社区贡献2条内容

所有评论(0)