交易汇总面板 - Flutter OpenHarmony数据展示
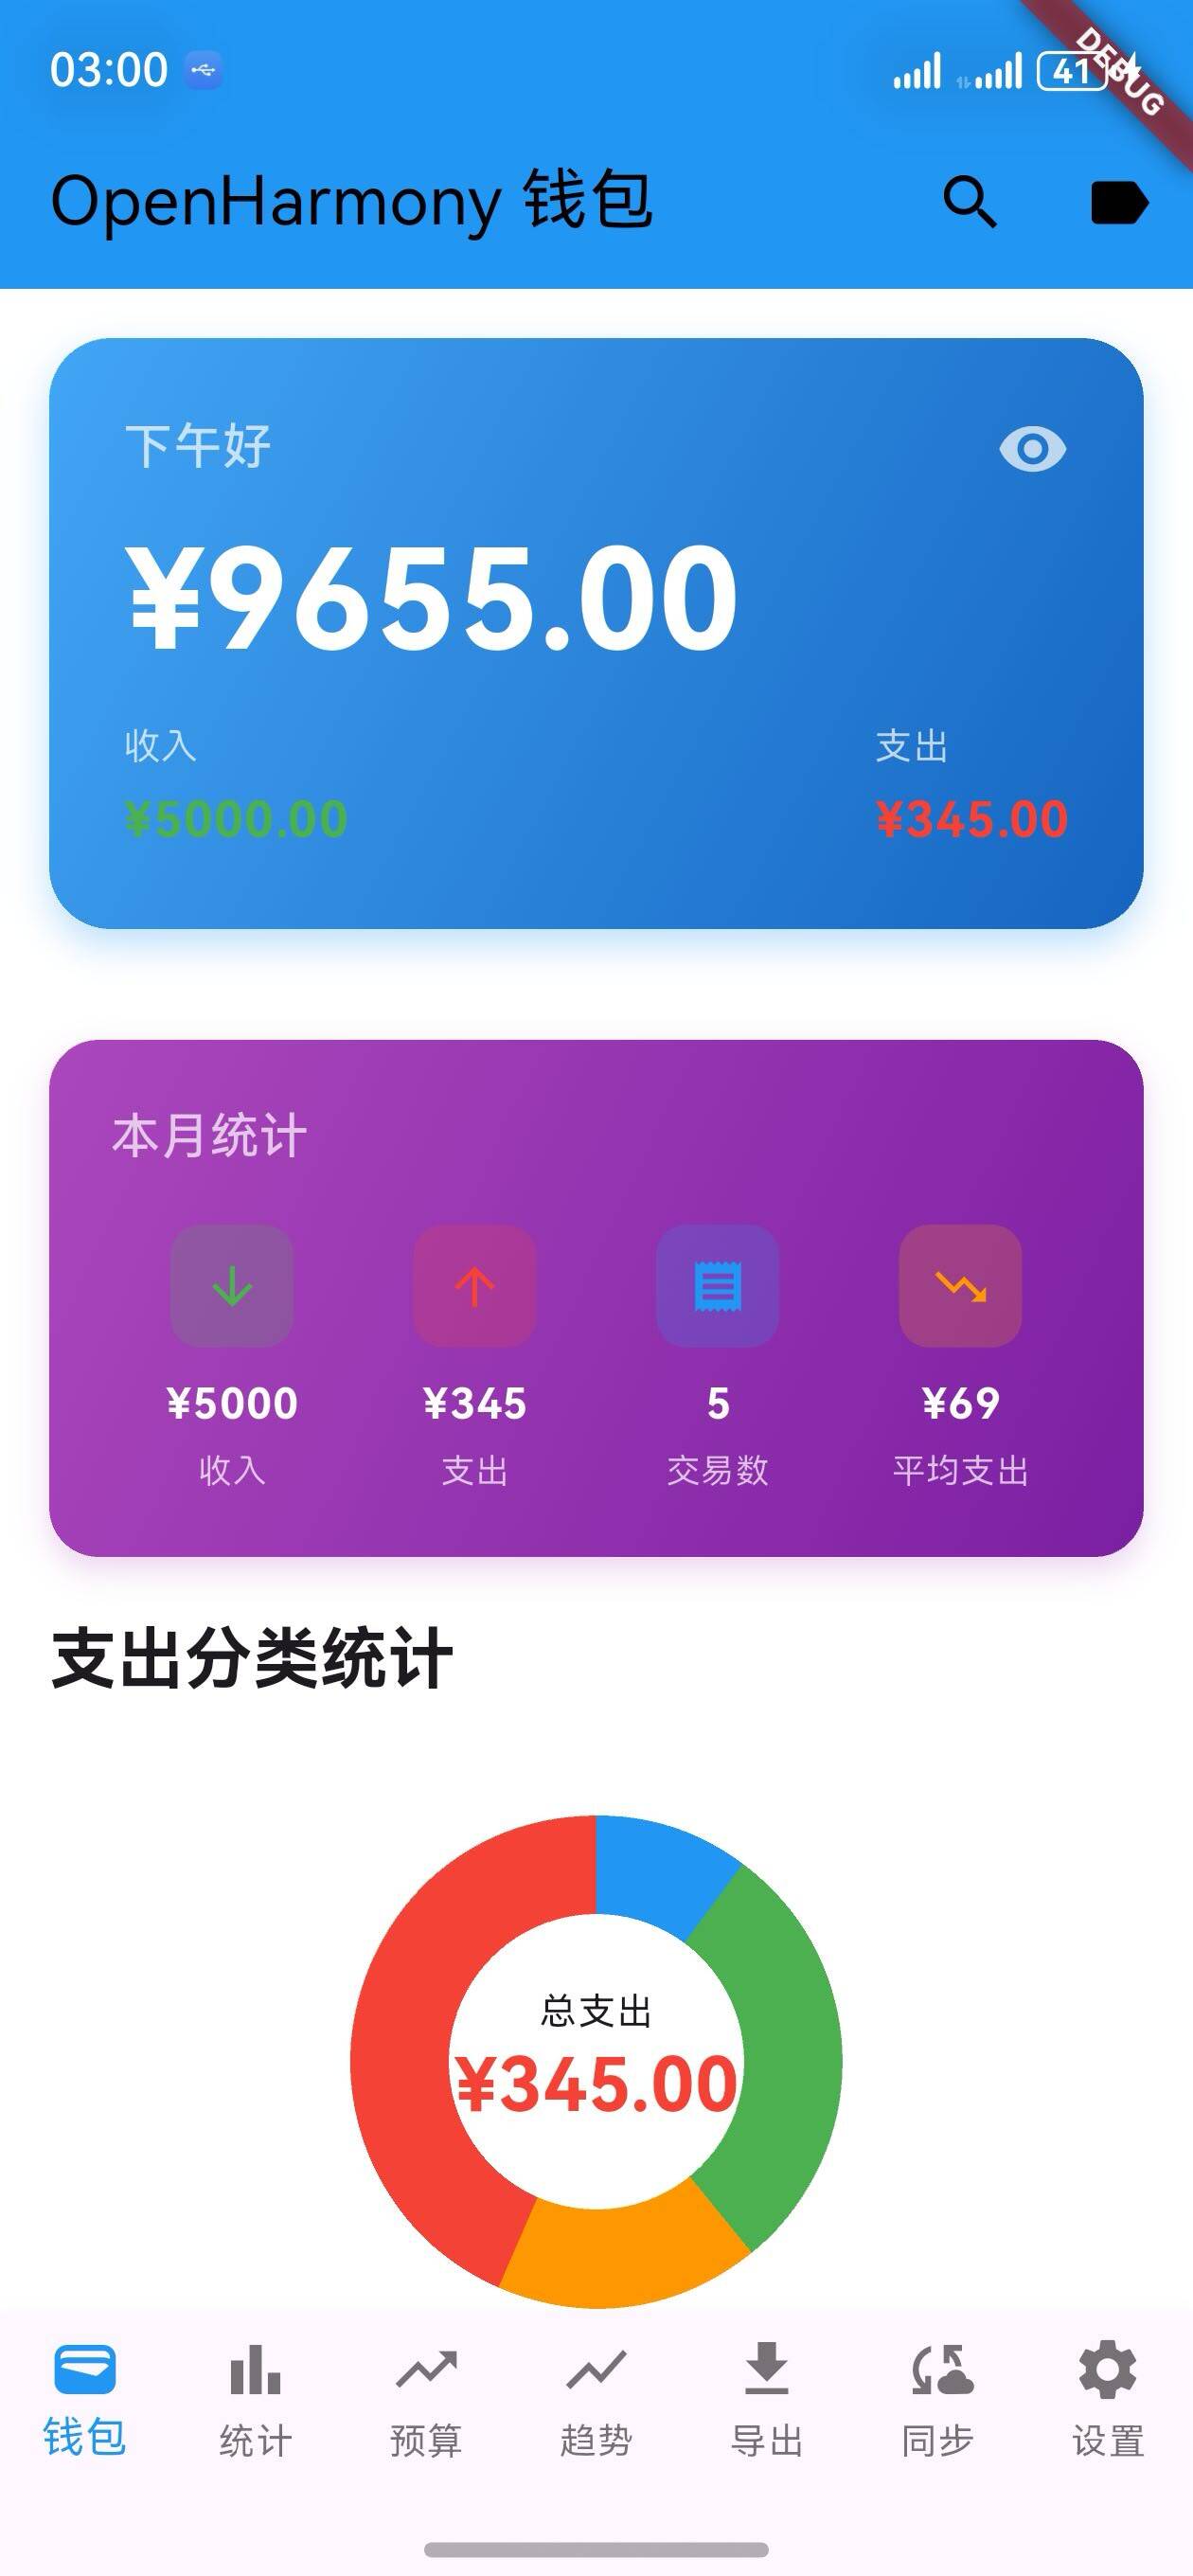
OpenHarmony 钱包应用 v1.27.0 新增交易统计汇总卡片功能。该卡片位于余额卡片下方,采用紫色渐变设计,展示本月关键财务数据:总收入、总支出、交易数量和平均支出。通过 _buildStatisticsSummary 方法计算各项指标,_buildSummaryItem 组件以图标+数值+标签的形式清晰呈现数据。用户无需进入详细统计页面即可快速掌握财务状况,便于监控支出情况并调整消费计
·
更新概述
v1.27.0 版本为 OpenHarmony 钱包应用增加了交易统计汇总卡片。在余额卡片下方,用户现在可以看到一个紫色的统计汇总卡片,展示本月的关键数据:总收入、总支出、交易数量和平均支出。这个卡片让用户能够快速了解自己的财务状况。
核心功能更新
1. 统计汇总卡片方法
_buildStatisticsSummary 方法
/// 构建统计汇总卡片
Widget _buildStatisticsSummary() {
  final totalIncome = _calculateTotalIncome();
  final totalExpense = _calculateTotalExpense();
  final transactionCount = _transactions.length;
  final averageAmount = transactionCount > 0 ? totalExpense / transactionCount : 0;

  return Padding(
    padding: const EdgeInsets.symmetric(horizontal: 16),
    child: Container(
      decoration: BoxDecoration(
        gradient: LinearGradient(
          colors: [Colors.purple.shade400, Colors.purple.shade700],
          begin: Alignment.topLeft,
          end: Alignment.bottomRight,
        ),
        borderRadius: BorderRadius.circular(16),
        boxShadow: [
          BoxShadow(
            color: Colors.purple.withOpacity(0.2),
            blurRadius: 8,
            offset: const Offset(0, 4),
          ),
        ],
      ),
      padding: const EdgeInsets.all(20),
      child: Column(
        crossAxisAlignment: CrossAxisAlignment.start,
        children: [
          Text(
            '本月统计',
            style: Theme.of(context).textTheme.titleMedium?.copyWith(
                  color: Colors.white70,
                  fontWeight: FontWeight.w500,
                ),
          ),
          const SizedBox(height: 16),
          Row(
            mainAxisAlignment: MainAxisAlignment.spaceBetween,
            children: [
              _buildSummaryItem(
                label: '收入',
                amount: totalIncome,
                color: Colors.green,
                icon: Icons.arrow_downward,
              ),
              _buildSummaryItem(
                label: '支出',
                amount: totalExpense,
                color: Colors.red,
                icon: Icons.arrow_upward,
              ),
              _buildSummaryItem(
                label: '交易数',
                amount: transactionCount.toDouble(),
                color: Colors.blue,
                icon: Icons.receipt,
                isCount: true,
              ),
              _buildSummaryItem(
                label: '平均支出',
                amount: averageAmount,
                color: Colors.orange,
                icon: Icons.trending_down,
              ),
            ],
          ),
        ],
      ),
    ),
  );
}
说明:
- 计算总收入、总支出、交易数量和平均支出
- 使用紫色渐变背景,视觉效果突出
- 显示四个关键指标
2. 汇总项组件
_buildSummaryItem 方法
/// 构建汇总项
Widget _buildSummaryItem({
  required String label,
  required double amount,
  required Color color,
  required IconData icon,
  bool isCount = false,
}) {
  return Expanded(
    child: Column(
      children: [
        Container(
          width: 40,
          height: 40,
          decoration: BoxDecoration(
            color: color.withOpacity(0.2),
            borderRadius: BorderRadius.circular(10),
          ),
          child: Icon(icon, color: color, size: 20),
        ),
        const SizedBox(height: 8),
        Text(
          isCount ? '${amount.toInt()}' : '¥${amount.toStringAsFixed(0)}',
          style: const TextStyle(
            color: Colors.white,
            fontWeight: FontWeight.bold,
            fontSize: 14,
          ),
        ),
        const SizedBox(height: 4),
        Text(
          label,
          style: TextStyle(
            color: Colors.white70,
            fontSize: 11,
          ),
        ),
      ],
    ),
  );
}
说明:
- 显示图标、数值和标签
- 支持显示金额或数量
- 使用彩色图标,视觉层次清晰
统计指标说明
| 指标 | 说明 | 计算方式 |
|---|---|---|
| 收入 | 本月总收入 | 所有收入交易的金额之和 |
| 支出 | 本月总支出 | 所有支出交易的金额之和 |
| 交易数 | 本月交易总数 | 所有交易的数量 |
| 平均支出 | 平均每笔支出金额 | 总支出 ÷ 交易数 |
UI 变化
统计汇总卡片布局
┌─────────────────────────────────┐
│  本月统计                        │
│                                 │
│  📥      📤      📋      📉     │
│  ¥5000   ¥195   5笔    ¥39    │
│  收入    支出   交易数  平均支出 │
└─────────────────────────────────┘
完整页面布局
┌─────────────────────────────────┐
│  余额卡片                        │
│  ¥45,000.00                     │
└─────────────────────────────────┘

┌─────────────────────────────────┐
│  本月统计                        │
│  📥 ¥5000  📤 ¥195  📋 5笔  📉 ¥39 │
└─────────────────────────────────┘

┌─────────────────────────────────┐
│  分类统计                        │
│  [饼图]                          │
└─────────────────────────────────┘

┌─────────────────────────────────┐
│  快速操作按钮                    │
│  [收入] [支出] [统计]           │
└─────────────────────────────────┘
使用场景
场景 1:快速了解财务状况
- 用户打开应用
- 立即看到本月的关键数据
- 快速了解收支情况
- 无需进入详细统计页面
场景 2:监控平均支出
- 用户查看平均支出金额
- 与上月对比
- 调整消费计划
- 实现理财目标
场景 3:交易数量统计
- 用户看到本月交易数量
- 了解自己的交易频率
- 评估消费习惯
- 做出更好的决策
功能特点
1. 一目了然
- 四个关键指标并排显示
- 数据清晰易读
- 快速获取信息
2. 视觉设计
- 紫色渐变背景,与其他卡片区分
- 彩色图标,增加视觉层次
- 圆角设计,现代感强
3. 实时更新
- 添加或删除交易时自动更新
- 无需手动刷新
- 数据始终准确
4. 多维度统计
- 收入和支出对比
- 交易数量统计
- 平均支出分析
- 全面了解财务状况
版本对比
| 功能 | v1.26.0 | v1.27.0 |
|---|---|---|
| 空状态插画 | ✅ | ✅ |
| 统计汇总卡片 | ❌ | ✅ |
| 关键指标显示 | ❌ | ✅ |
| 一目了然 | ❌ | ✅ |
技术实现
1. 数据计算
final totalIncome = _calculateTotalIncome();
final totalExpense = _calculateTotalExpense();
final transactionCount = _transactions.length;
final averageAmount = transactionCount > 0 ? totalExpense / transactionCount : 0;
2. 渐变背景
gradient: LinearGradient(
  colors: [Colors.purple.shade400, Colors.purple.shade700],
  begin: Alignment.topLeft,
  end: Alignment.bottomRight,
)
3. 图标容器
Container(
  width: 40,
  height: 40,
  decoration: BoxDecoration(
    color: color.withOpacity(0.2),
    borderRadius: BorderRadius.circular(10),
  ),
  child: Icon(icon, color: color, size: 20),
)
设计亮点
1. 色彩搭配
- 紫色渐变背景独特且专业
- 彩色图标增加视觉吸引力
- 与整体应用风格协调
2. 排版设计
- 标题清晰,说明用途
- 数值突出,易于阅读
- 标签简洁,信息完整
3. 空间布局
- 四个指标均匀分布
- 图标、数值、标签垂直排列
- 整体设计紧凑高效
用户体验优化
1. 信息架构
- 最重要的数据优先显示
- 逻辑清晰,易于理解
- 帮助用户快速决策
2. 视觉反馈
- 彩色图标提供视觉反馈
- 渐变背景增加视觉吸引力
- 整体设计显得更专业
3. 数据准确性
- 实时计算,无延迟
- 与交易列表同步
- 用户可信任
欢迎加入开源鸿蒙跨平台社区:https://openharmonycrossplatform.csdn.net

开源鸿蒙跨平台开发社区汇聚开发者与厂商,共建“一次开发,多端部署”的开源生态,致力于降低跨端开发门槛,推动万物智联创新。
更多推荐
 3
3 0
0- 0


 已为社区贡献6条内容

所有评论(0)