报表生成 - OpenHarmony Flutter数据报告
交易统计报告功能更新 OpenHarmony 钱包应用 v1.15.0 版本新增了交易统计报告功能,帮助用户全面掌握财务状况。该功能通过 TransactionReport 类模型记录交易数据,提供收入支出总额、分类统计等关键指标,并支持计算平均交易金额和最大/最小交易等实用信息。TransactionReportService 服务类实现了报告生成和日期范围描述功能,界面部分则通过精美的报告头设
·
更新概述
v1.15.0 版本为 OpenHarmony 钱包应用增加了详细的交易统计报告功能。用户现在可以通过搜索页面的报告按钮生成全面的交易统计报告,包括关键指标、分类分析和交易统计。这个新功能帮助用户深入了解交易数据,做出更明智的财务决策。
核心功能更新
1. 交易统计报告模型
TransactionReport 类定义
/// 交易统计报告模型
class TransactionReport {
  final DateTime startDate;
  final DateTime endDate;
  final double totalIncome;
  final double totalExpense;
  final double balance;
  final int incomeCount;
  final int expenseCount;
  final Map<String, double> categoryStats;
  final Map<String, int> categoryCount;
  final double averageTransaction;
  final double maxTransaction;
  final double minTransaction;

  TransactionReport({
    required this.startDate,
    required this.endDate,
    required this.totalIncome,
    required this.totalExpense,
    required this.balance,
    required this.incomeCount,
    required this.expenseCount,
    required this.categoryStats,
    required this.categoryCount,
    required this.averageTransaction,
    required this.maxTransaction,
    required this.minTransaction,
  });

  /// 获取交易总数
  int get totalCount => incomeCount + expenseCount;

  /// 获取平均收入
  double get averageIncome => incomeCount > 0 ? totalIncome / incomeCount : 0;

  /// 获取平均支出
  double get averageExpense => expenseCount > 0 ? totalExpense / expenseCount : 0;

  /// 获取最高支出分类
  String? get topExpenseCategory {
    if (categoryStats.isEmpty) return null;
    return categoryStats.entries
        .reduce((a, b) => a.value > b.value ? a : b)
        .key;
  }
}
说明:
- 记录统计周期(开始日期和结束日期)
- 记录收支总额和结余
- 记录交易笔数和分类统计
- 提供计算属性:平均收入、平均支出、最高分类
关键指标说明
| 指标 | 说明 | 用途 |
|---|---|---|
| 总收入 | 统计周期内的总收入 | 了解收入规模 |
| 总支出 | 统计周期内的总支出 | 了解支出规模 |
| 结余 | 收入减去支出 | 了解财务状况 |
| 平均交易 | 所有交易的平均金额 | 了解交易规模 |
| 最大交易 | 最大的单笔交易 | 了解异常交易 |
| 最小交易 | 最小的单笔交易 | 了解交易范围 |
2. 交易统计报告服务
TransactionReportService 类
/// 交易统计报告服务
class TransactionReportService {
  /// 生成统计报告
  static TransactionReport generateReport(
    List<wallet.Transaction> transactions,
    DateTime startDate,
    DateTime endDate,
  ) {
    double totalIncome = 0;
    double totalExpense = 0;
    int incomeCount = 0;
    int expenseCount = 0;
    Map<String, double> categoryStats = {};
    Map<String, int> categoryCount = {};
    List<double> amounts = [];

    // 过滤日期范围内的交易
    final filtered = transactions.where((t) {
      return t.date.isAfter(startDate) && t.date.isBefore(endDate.add(const Duration(days: 1)));
    }).toList();

    // 计算统计数据
    for (var transaction in filtered) {
      amounts.add(transaction.amount);

      if (transaction.type == wallet.TransactionType.income) {
        totalIncome += transaction.amount;
        incomeCount++;
      } else {
        totalExpense += transaction.amount;
        expenseCount++;
      }

      // 分类统计
      categoryStats[transaction.category] =
          (categoryStats[transaction.category] ?? 0) + transaction.amount;
      categoryCount[transaction.category] = (categoryCount[transaction.category] ?? 0) + 1;
    }

    final balance = totalIncome - totalExpense;
    final totalCount = incomeCount + expenseCount;
    final averageTransaction = totalCount > 0 ? (totalIncome + totalExpense) / totalCount : 0.0;
    final maxTransaction = amounts.isNotEmpty ? amounts.reduce((a, b) => a > b ? a : b) : 0.0;
    final minTransaction = amounts.isNotEmpty ? amounts.reduce((a, b) => a < b ? a : b) : 0.0;

    return TransactionReport(
      startDate: startDate,
      endDate: endDate,
      totalIncome: totalIncome,
      totalExpense: totalExpense,
      balance: balance,
      incomeCount: incomeCount,
      expenseCount: expenseCount,
      categoryStats: categoryStats,
      categoryCount: categoryCount,
      averageTransaction: averageTransaction,
      maxTransaction: maxTransaction,
      minTransaction: minTransaction,
    );
  }

  /// 获取日期范围描述
  static String getDateRangeDescription(DateTime startDate, DateTime endDate) {
    final daysDiff = endDate.difference(startDate).inDays + 1;
    if (daysDiff == 1) {
      return '${startDate.month}月${startDate.day}日';
    } else if (daysDiff <= 7) {
      return '${startDate.month}/${startDate.day} - ${endDate.month}/${endDate.day}';
    } else if (daysDiff <= 31) {
      return '${startDate.month}月${startDate.day}日 - ${endDate.month}月${endDate.day}日';
    } else {
      return '${startDate.year}年${startDate.month}月 - ${endDate.year}年${endDate.month}月';
    }
  }
}
说明:
generateReport: 生成指定日期范围的统计报告getDateRangeDescription: 获取日期范围的人性化描述
3. 交易统计报告页面
报告头
/// 构建报告头
Widget _buildReportHeader(TransactionReport report) {
  return Padding(
    padding: const EdgeInsets.symmetric(horizontal: 16),
    child: Container(
      padding: const EdgeInsets.all(20),
      decoration: BoxDecoration(
        gradient: LinearGradient(
          colors: [Colors.indigo.shade400, Colors.indigo.shade800],
          begin: Alignment.topLeft,
          end: Alignment.bottomRight,
        ),
        borderRadius: BorderRadius.circular(20),
      ),
      child: Column(
        crossAxisAlignment: CrossAxisAlignment.start,
        children: [
          Text('统计周期', style: Theme.of(context).textTheme.bodySmall),
          const SizedBox(height: 8),
          Text(
            TransactionReportService.getDateRangeDescription(
              report.startDate,
              report.endDate,
            ),
            style: const TextStyle(color: Colors.white, fontSize: 18, fontWeight: FontWeight.bold),
          ),
          const SizedBox(height: 16),
          Row(
            mainAxisAlignment: MainAxisAlignment.spaceBetween,
            children: [
              Column(
                crossAxisAlignment: CrossAxisAlignment.start,
                children: [
                  Text('总交易数', style: Theme.of(context).textTheme.bodySmall),
                  const SizedBox(height: 4),
                  Text('${report.totalCount}', style: const TextStyle(color: Colors.white, fontSize: 20)),
                ],
              ),
              Column(
                crossAxisAlignment: CrossAxisAlignment.start,
                children: [
                  Text('结余', style: Theme.of(context).textTheme.bodySmall),
                  const SizedBox(height: 4),
                  Text(
                    '¥${report.balance.toStringAsFixed(2)}',
                    style: TextStyle(
                      color: report.balance >= 0 ? Colors.greenAccent : Colors.redAccent,
                      fontSize: 20,
                      fontWeight: FontWeight.bold,
                    ),
                  ),
                ],
              ),
            ],
          ),
        ],
      ),
    ),
  );
}
说明:
- 显示统计周期
- 显示总交易数和结余
- 紫色渐变背景

关键指标
/// 构建关键指标
Widget _buildKeyMetrics(TransactionReport report) {
  return Padding(
    padding: const EdgeInsets.symmetric(horizontal: 16),
    child: Container(
      padding: const EdgeInsets.all(16),
      decoration: BoxDecoration(
        border: Border.all(color: Colors.grey.shade300),
        borderRadius: BorderRadius.circular(12),
      ),
      child: Column(
        crossAxisAlignment: CrossAxisAlignment.start,
        children: [
          Text('关键指标', style: Theme.of(context).textTheme.titleMedium),
          const SizedBox(height: 16),
          _buildMetricRow('总收入', '¥${report.totalIncome.toStringAsFixed(2)}', Colors.green, '${report.incomeCount} 笔'),
          const SizedBox(height: 12),
          _buildMetricRow('总支出', '¥${report.totalExpense.toStringAsFixed(2)}', Colors.red, '${report.expenseCount} 笔'),
          const SizedBox(height: 12),
          _buildMetricRow('平均交易', '¥${report.averageTransaction.toStringAsFixed(2)}', Colors.blue, '每笔'),
          const SizedBox(height: 12),
          _buildMetricRow('最大交易', '¥${report.maxTransaction.toStringAsFixed(2)}', Colors.orange, '单笔'),
          const SizedBox(height: 12),
          _buildMetricRow('最小交易', '¥${report.minTransaction.toStringAsFixed(2)}', Colors.purple, '单笔'),
        ],
      ),
    ),
  );
}
说明:
- 显示 5 个关键指标
- 使用彩色指示条
- 显示单位信息
分类分析
/// 构建分类分析
Widget _buildCategoryBreakdown(TransactionReport report) {
  return Padding(
    padding: const EdgeInsets.symmetric(horizontal: 16),
    child: Container(
      padding: const EdgeInsets.all(16),
      decoration: BoxDecoration(
        border: Border.all(color: Colors.grey.shade300),
        borderRadius: BorderRadius.circular(12),
      ),
      child: Column(
        crossAxisAlignment: CrossAxisAlignment.start,
        children: [
          Text('分类分析', style: Theme.of(context).textTheme.titleMedium),
          const SizedBox(height: 16),
          ...report.categoryStats.entries.map((entry) {
            final category = entry.key;
            final amount = entry.value;
            final count = report.categoryCount[category] ?? 0;
            final percentage = report.totalIncome + report.totalExpense > 0
                ? (amount / (report.totalIncome + report.totalExpense) * 100)
                : 0.0;

            return Padding(
              padding: const EdgeInsets.only(bottom: 12),
              child: Column(
                crossAxisAlignment: CrossAxisAlignment.start,
                children: [
                  Row(
                    mainAxisAlignment: MainAxisAlignment.spaceBetween,
                    children: [
                      Text(category, style: const TextStyle(fontWeight: FontWeight.w600)),
                      Text('¥${amount.toStringAsFixed(2)}', style: const TextStyle(fontWeight: FontWeight.bold)),
                    ],
                  ),
                  const SizedBox(height: 6),
                  Row(
                    children: [
                      Expanded(
                        child: LinearProgressIndicator(
                          value: percentage / 100,
                          minHeight: 6,
                        ),
                      ),
                      const SizedBox(width: 8),
                      Text('${percentage.toStringAsFixed(1)}%'),
                    ],
                  ),
                  const SizedBox(height: 4),
                  Text('$count 笔交易', style: Theme.of(context).textTheme.bodySmall),
                ],
              ),
            );
          }).toList(),
        ],
      ),
    ),
  );
}
说明:
- 显示每个分类的统计数据
- 显示金额和百分比
- 显示交易笔数
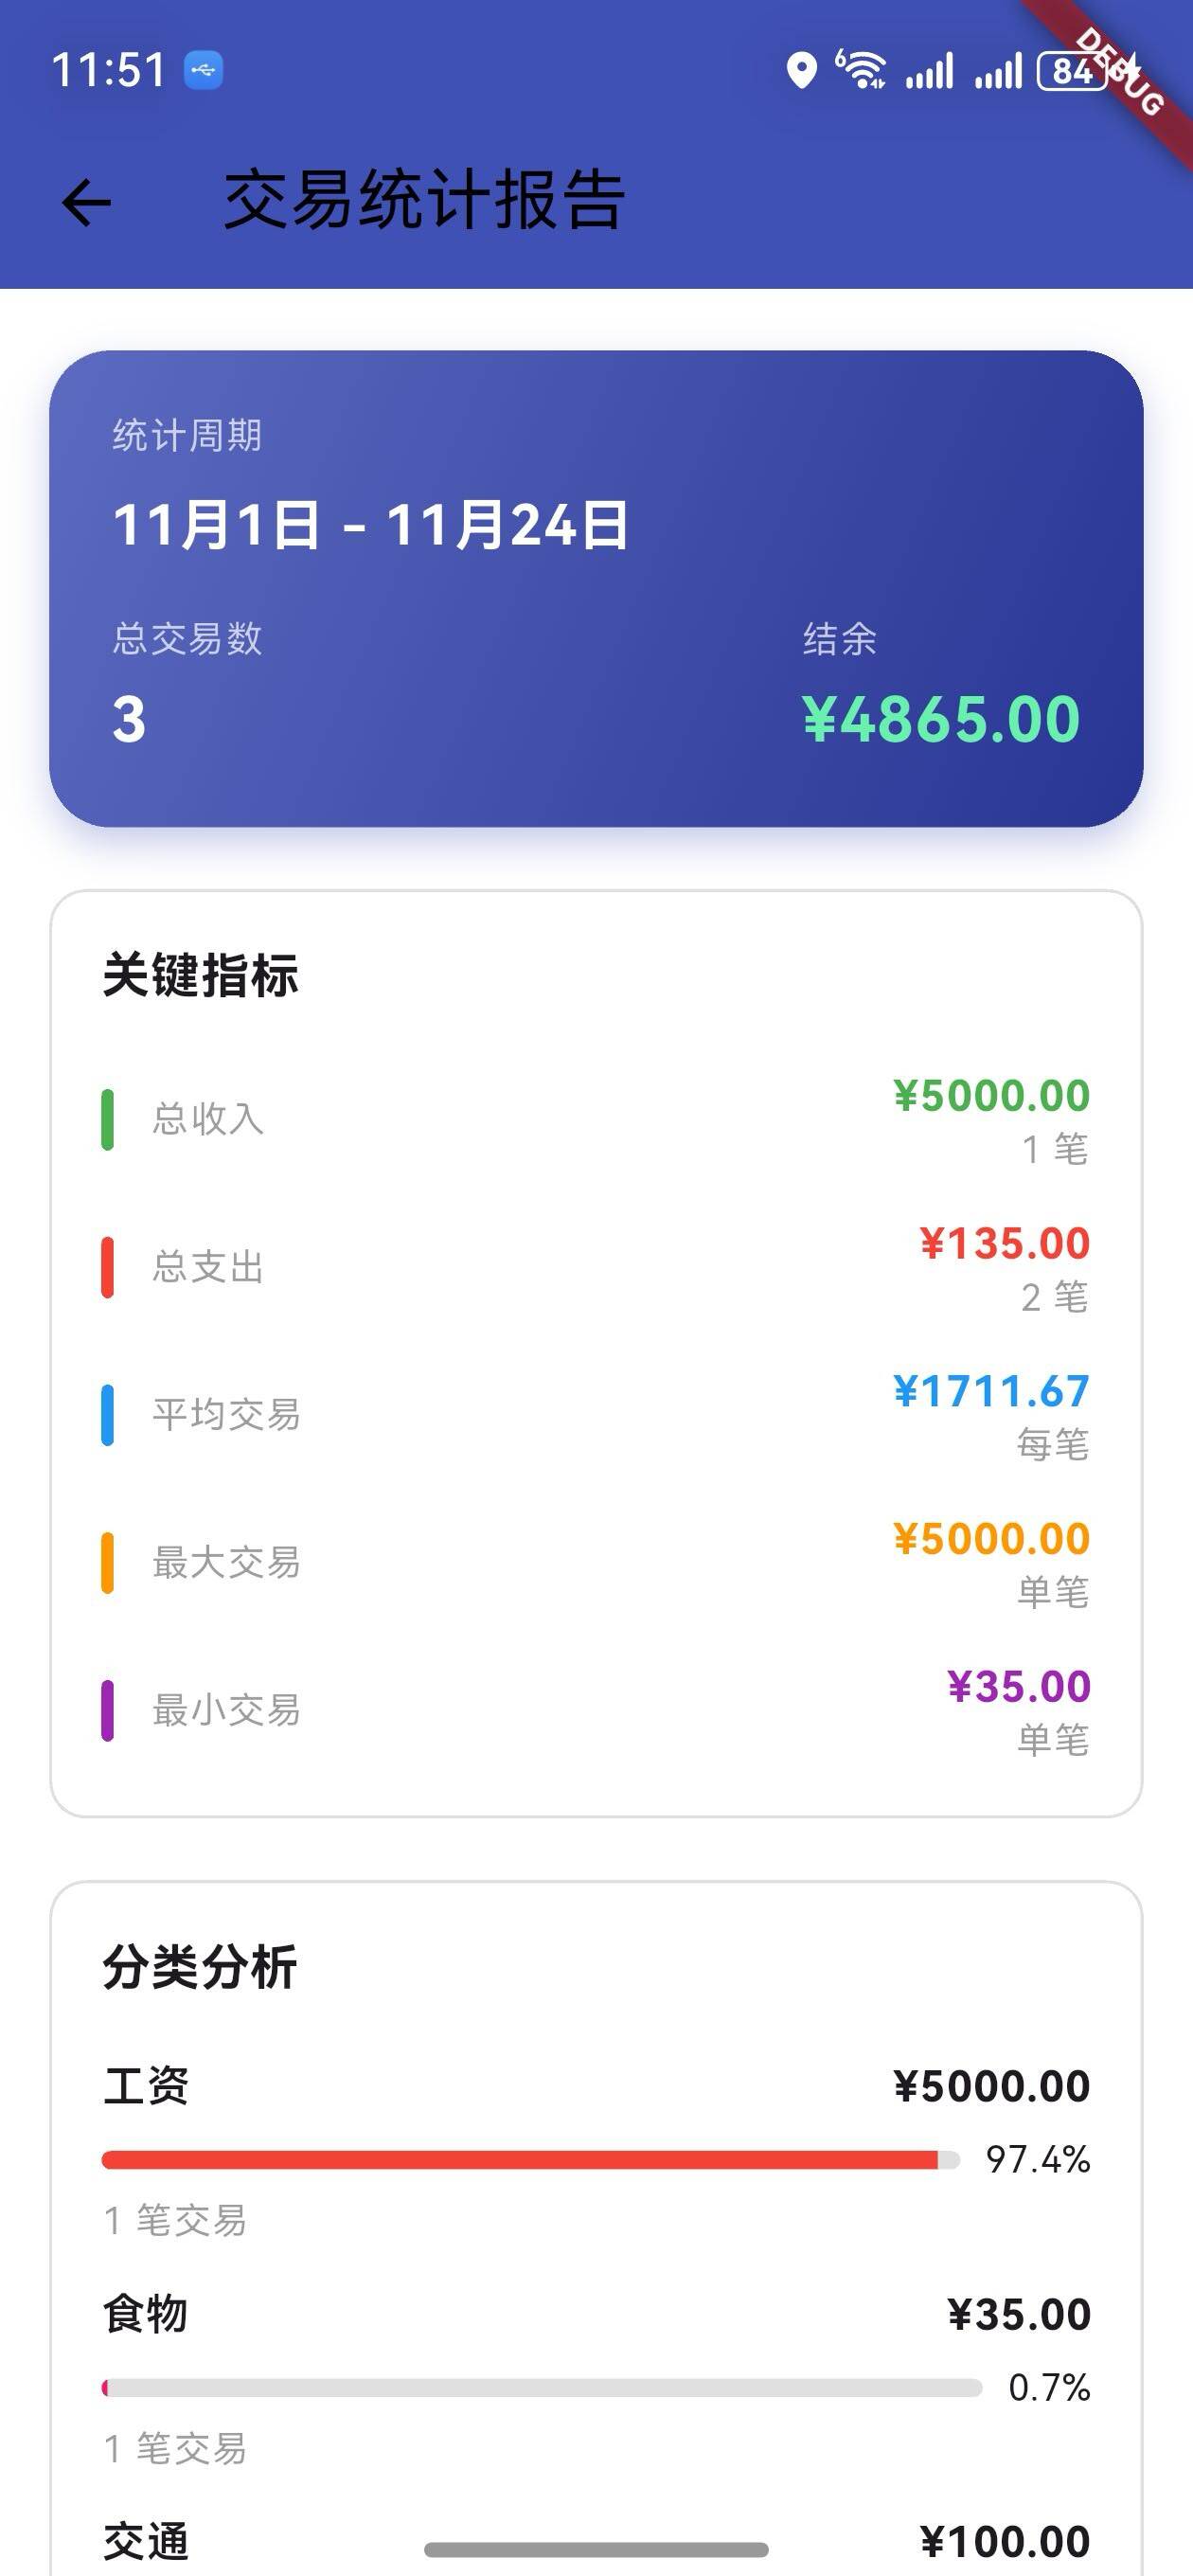
UI 变化
交易统计报告页面布局
┌─────────────────────────────────┐
│  交易统计报告                    │
├─────────────────────────────────┤
│  统计周期: 12月1日 - 12月31日   │
│  总交易数: 25    结余: ¥2500    │
├─────────────────────────────────┤
│  关键指标                        │
│  | 总收入      ¥5000  (10笔)   │
│  | 总支出      ¥2500  (15笔)   │
│  | 平均交易    ¥300   (每笔)   │
│  | 最大交易    ¥1000  (单笔)   │
│  | 最小交易    ¥50    (单笔)   │
├─────────────────────────────────┤
│  分类分析                        │
│  食物        ¥800               │
│  [████████░░░░░░░░░░] 32%      │
│  5 笔交易                        │
│                                 │
│  交通        ¥500               │
│  [█████░░░░░░░░░░░░░░] 20%     │
│  3 笔交易                        │
├─────────────────────────────────┤
│  交易统计                        │
│  收入笔数: 10    平均收入: ¥500 │
│  支出笔数: 15    平均支出: ¥167 │
└─────────────────────────────────┘
访问方式
- 进入搜索交易页面
- 点击 AppBar 右侧的报告按钮(📊)
- 进入交易统计报告页面
版本对比
| 功能 | v1.14.0 | v1.15.0 |
|---|---|---|
| 交易搜索 | ✅ | ✅ |
| 多维度筛选 | ✅ | ✅ |
| 搜索结果展示 | ✅ | ✅ |
| 统计报告模型 | ❌ | ✅ |
| 统计报告服务 | ❌ | ✅ |
| 关键指标显示 | ❌ | ✅ |
| 分类分析 | ❌ | ✅ |
| 交易统计 | ❌ | ✅ |
| 日期范围描述 | ❌ | ✅ |
使用场景
场景 1:查看月度报告
- 进入搜索页面
- 点击报告按钮
- 查看当月的统计报告
- 了解收支情况
场景 2:分析分类支出
- 进入报告页面
- 查看分类分析部分
- 了解各分类的支出占比
- 调整消费结构
场景 3:查看交易统计
- 进入报告页面
- 查看交易统计部分
- 了解收入和支出的平均值
- 评估财务状况
场景 4:对比关键指标
- 进入报告页面
- 查看关键指标部分
- 对比最大和最小交易
- 了解交易范围
技术亮点
1. 灵活的报告生成
- 支持任意日期范围
- 自动计算各项指标
- 高效的数据聚合
2. 丰富的指标体系
- 10+ 个关键指标
- 分类统计
- 交易统计
3. 直观的数据展示
- 进度条显示占比
- 彩色指示条
- 清晰的数据分组
4. 人性化的日期描述
- 自动选择合适的格式
- 支持多种时间范围
- 易于理解
下一步计划
v1.16.0 将继续增强功能,计划增加:
- 📅 日历视图
- 💳 账户管理
- 🔔 交易提醒
- 📈 更多图表类型
感谢使用 OpenHarmony 钱包! 🎉
如有建议或问题,欢迎反馈。
欢迎加入开源鸿蒙跨平台社区:https://openharmonycrossplatform.csdn.net

开源鸿蒙跨平台开发社区汇聚开发者与厂商,共建“一次开发,多端部署”的开源生态,致力于降低跨端开发门槛,推动万物智联创新。
更多推荐
 5
5 0
0- 0


 已为社区贡献10条内容

所有评论(0)